Quick Start
Install DebugSwift, call setup(), and inspect your first network request in minutes.
This guide gets you from zero to a working debugger overlay. You only need a DEBUG build, one setup call, and a running simulator or device.
1. Add the package
In Xcode, go to File → Add Package Dependencies and paste the DebugSwift repository URL. Or add the CocoaPods line to your Podfile.
// Package.swift or Xcode SPM
package(url: "https://github.com/DebugSwift/DebugSwift.git", from: "1.0.0")
2. Call setup() in AppDelegate
Import DebugSwift and call setup() during application launch. Wrap everything in #if DEBUG so the toolkit never ships to production.
import DebugSwift

#if DEBUG
let debugSwift = DebugSwift()

func application() -> Bool {
    debugSwift.setup()
    debugSwift.show()  // floating debug ball
    return true
}
#endif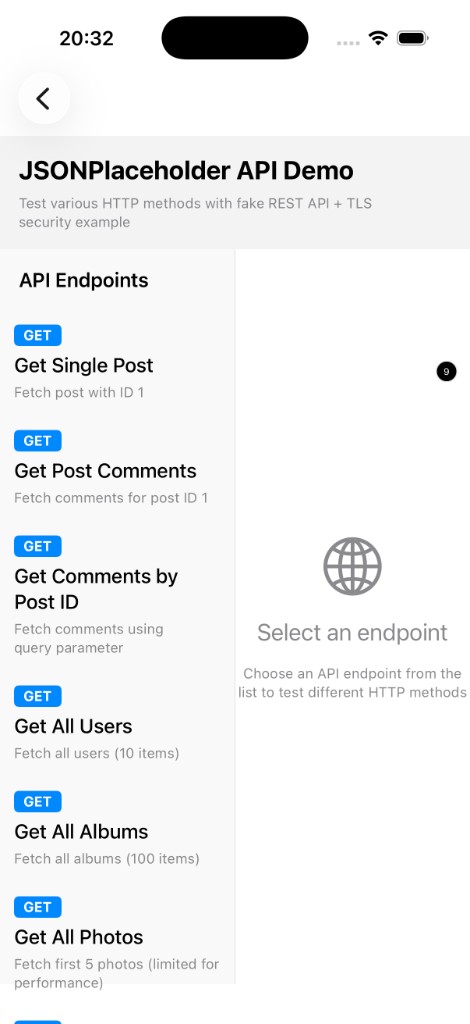
3. Tap the ball and open Network
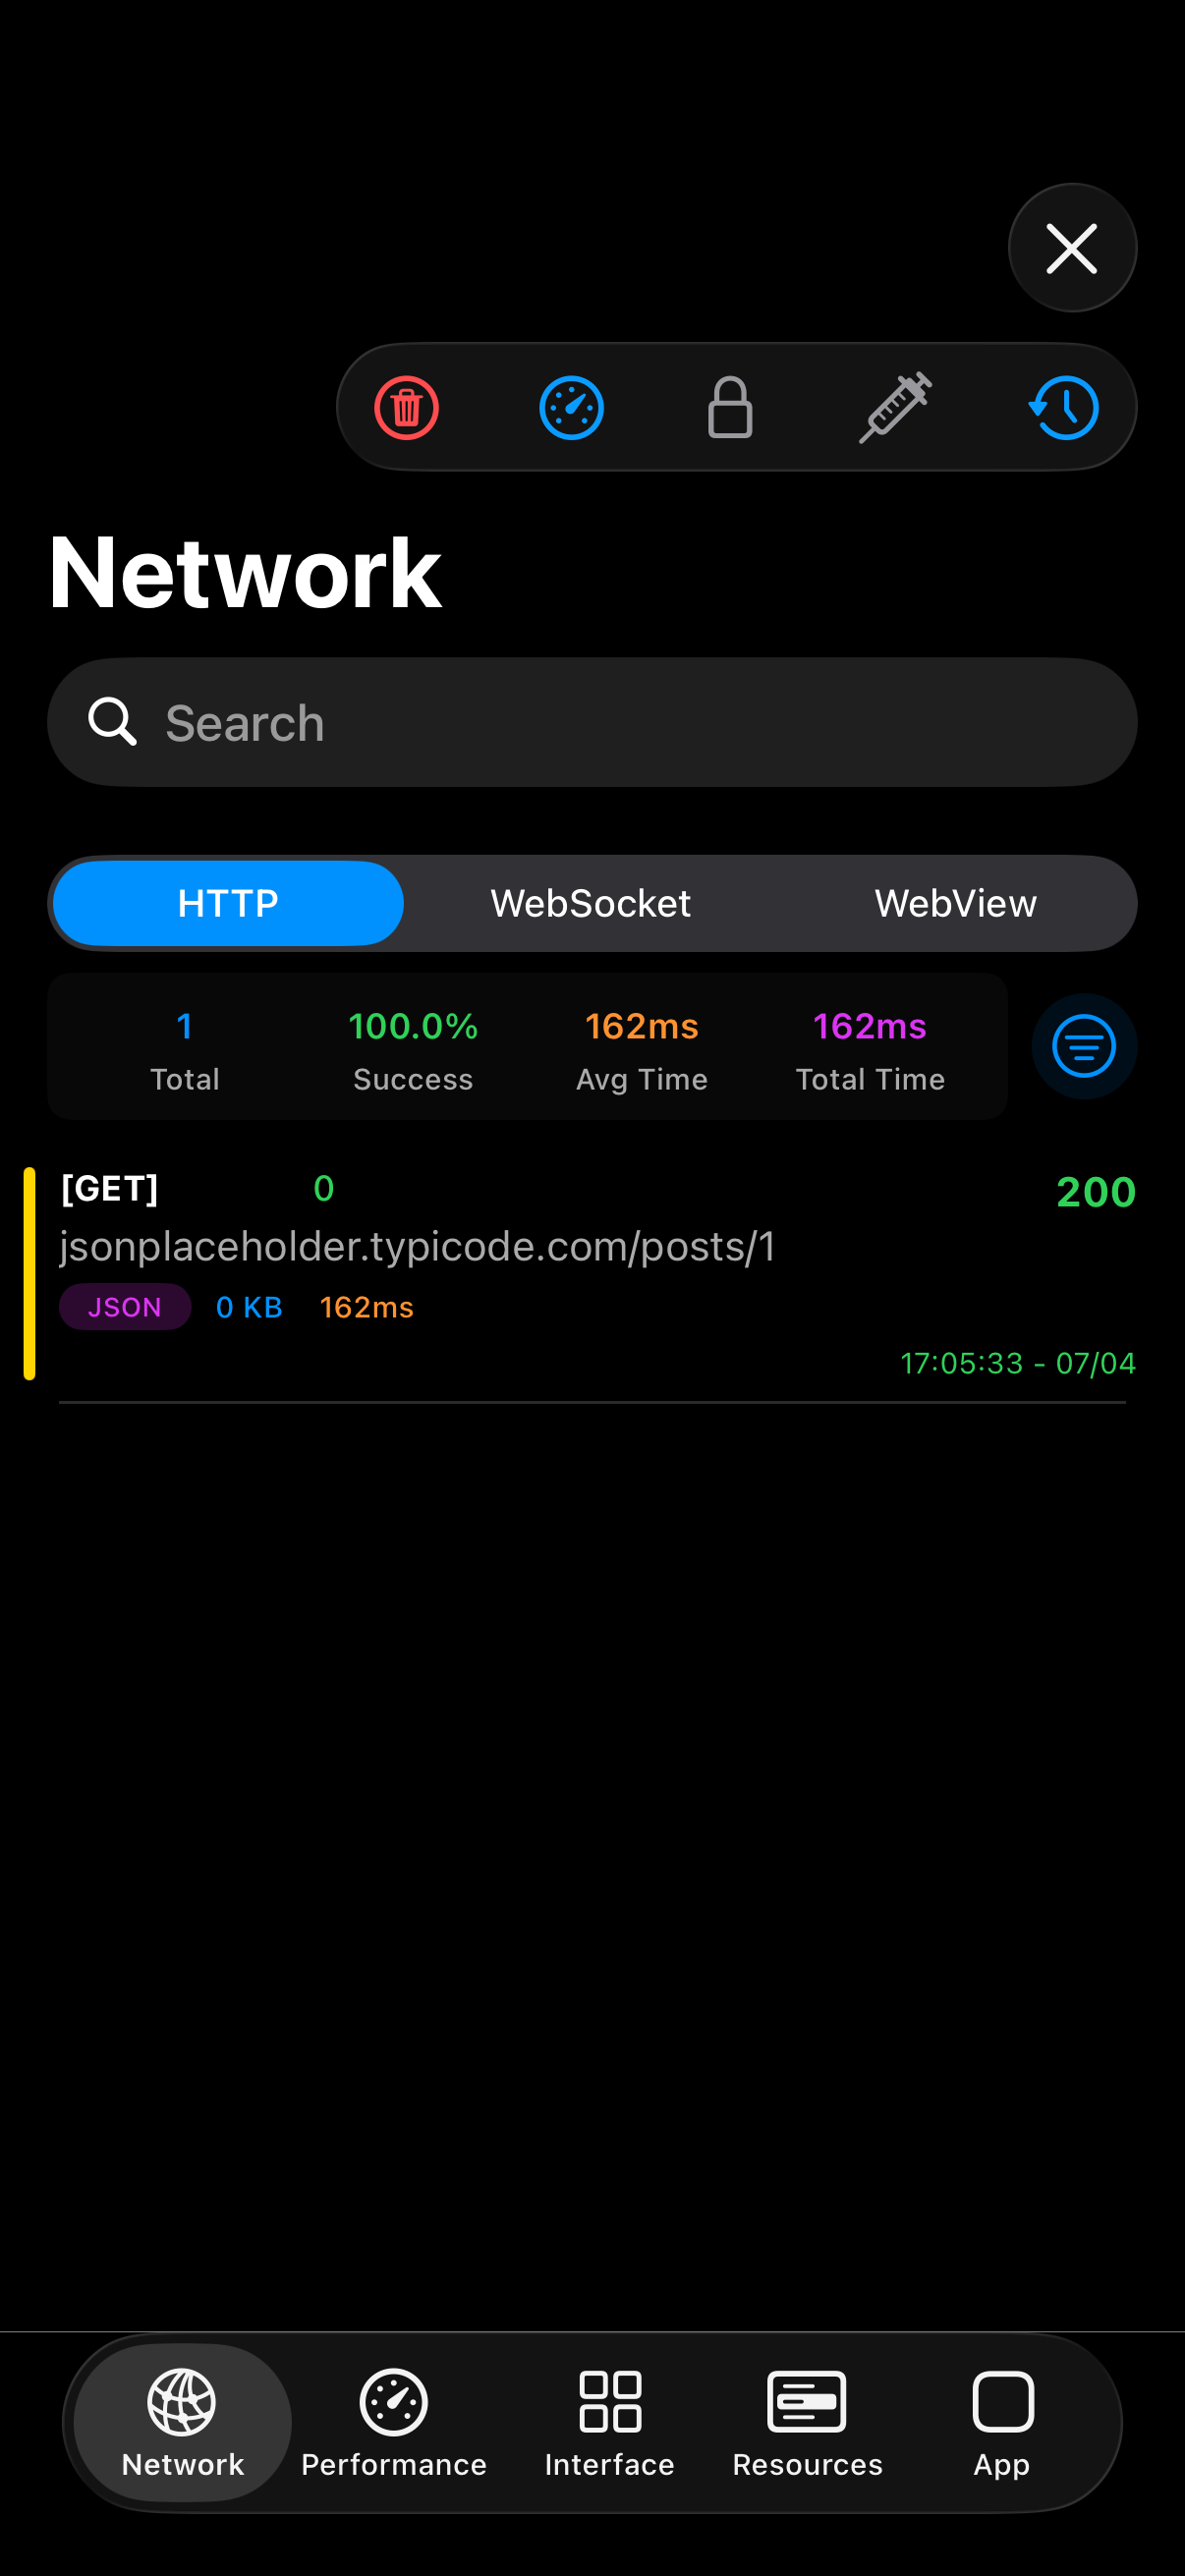
Trigger any URLSession request in your app. Open the Network tab in DebugSwift to see the captured request with headers, body, and timing.
4. Optional: shake to toggle
Override motionEnded on UIWindow to toggle the debugger with a device shake gesture.
Next steps
- Configure URL filters to reduce noise from analytics endpoints
- Try the Response Modifier to mock an API without a backend
- Present debugViewController() programmatically instead of the floating ball