See everything.Fix faster.
Open-source in-app debugging toolkit for iOS. Inspect network traffic, monitor performance, browse resources, and debug UI, all from a floating overlay inside your app.
iOS 14.0+ · Swift 6.0+ · Xcode 16.0+ · Apple Silicon ready
import DebugSwift

#if DEBUG
let debugSwift = DebugSwift()

func application() -> Bool {
    debugSwift.setup()
    debugSwift.show()
    return true
}
#endifFrom symptom to proof, inside the app
Move from 'something feels slow' to measurable CPU spikes, leaked view controllers, and the exact API call that failed.
In-app, not external
Debug from a floating overlay inside your running app. No proxy setup, no certificate trust dance, no second machine.
One toolkit, every layer
Network, performance, crashes, UI inspection, and sandbox resources, unified in a single native debugger.
Open source by default
MIT licensed, fully auditable. Inspect the swizzling, encryption hooks, and UI code before you ship to TestFlight.
All-in-one debugging, embedded in your app
Inspect network, performance, UI, and sandbox data without switching tools.
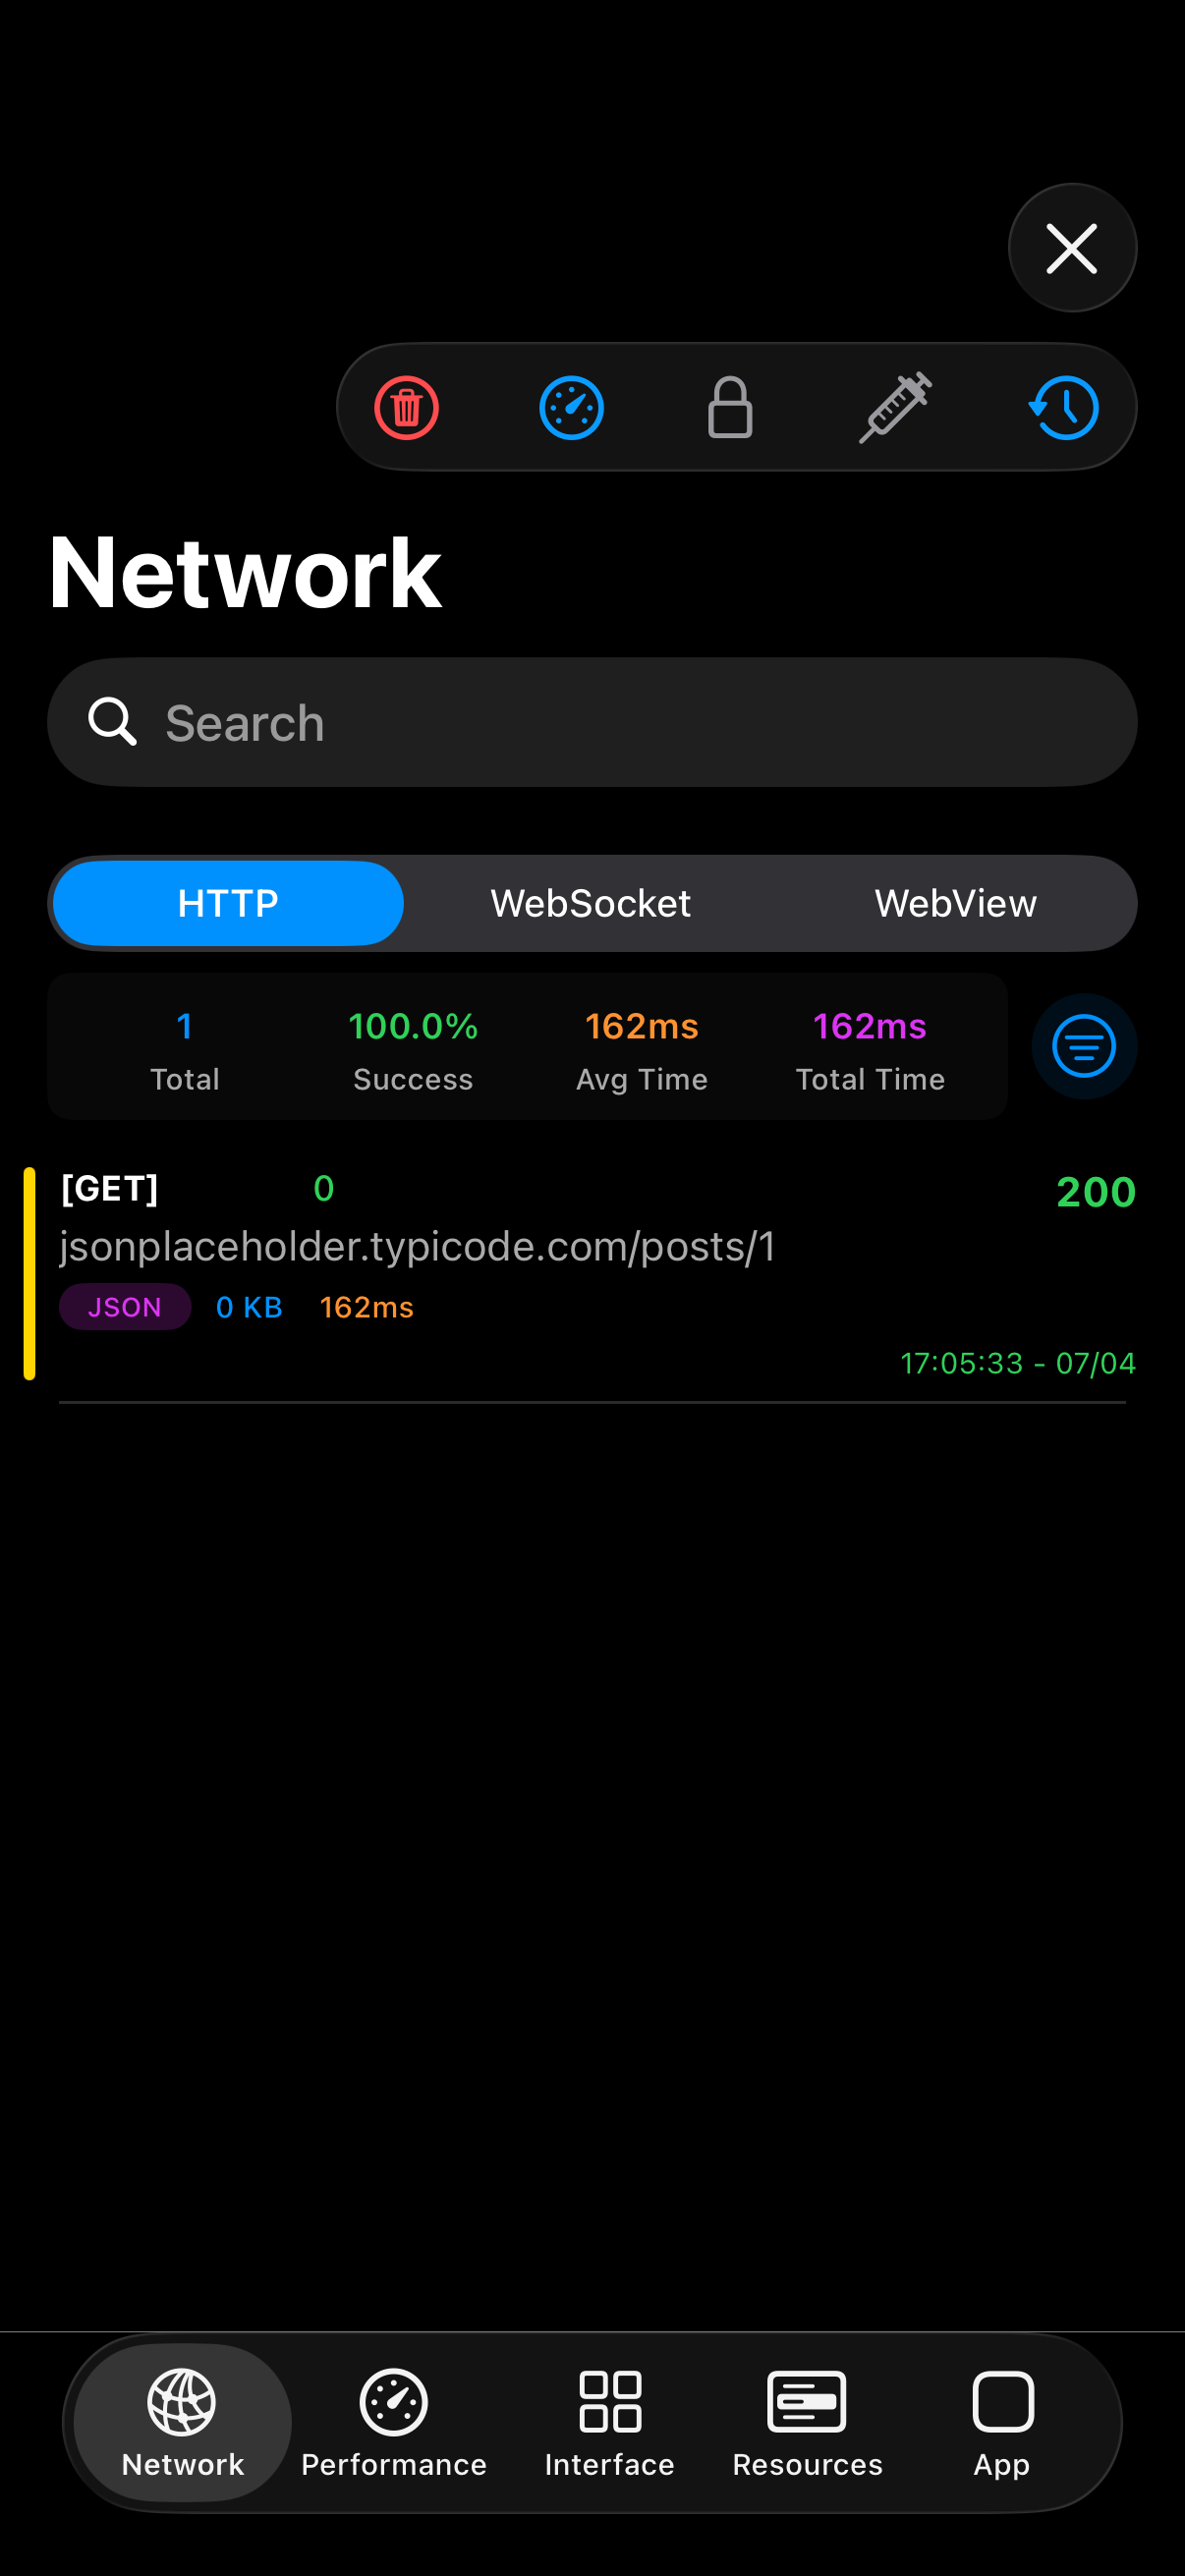

Network Inspector
HTTP, WebSocket, encryption decrypt, response modifier, and session history.
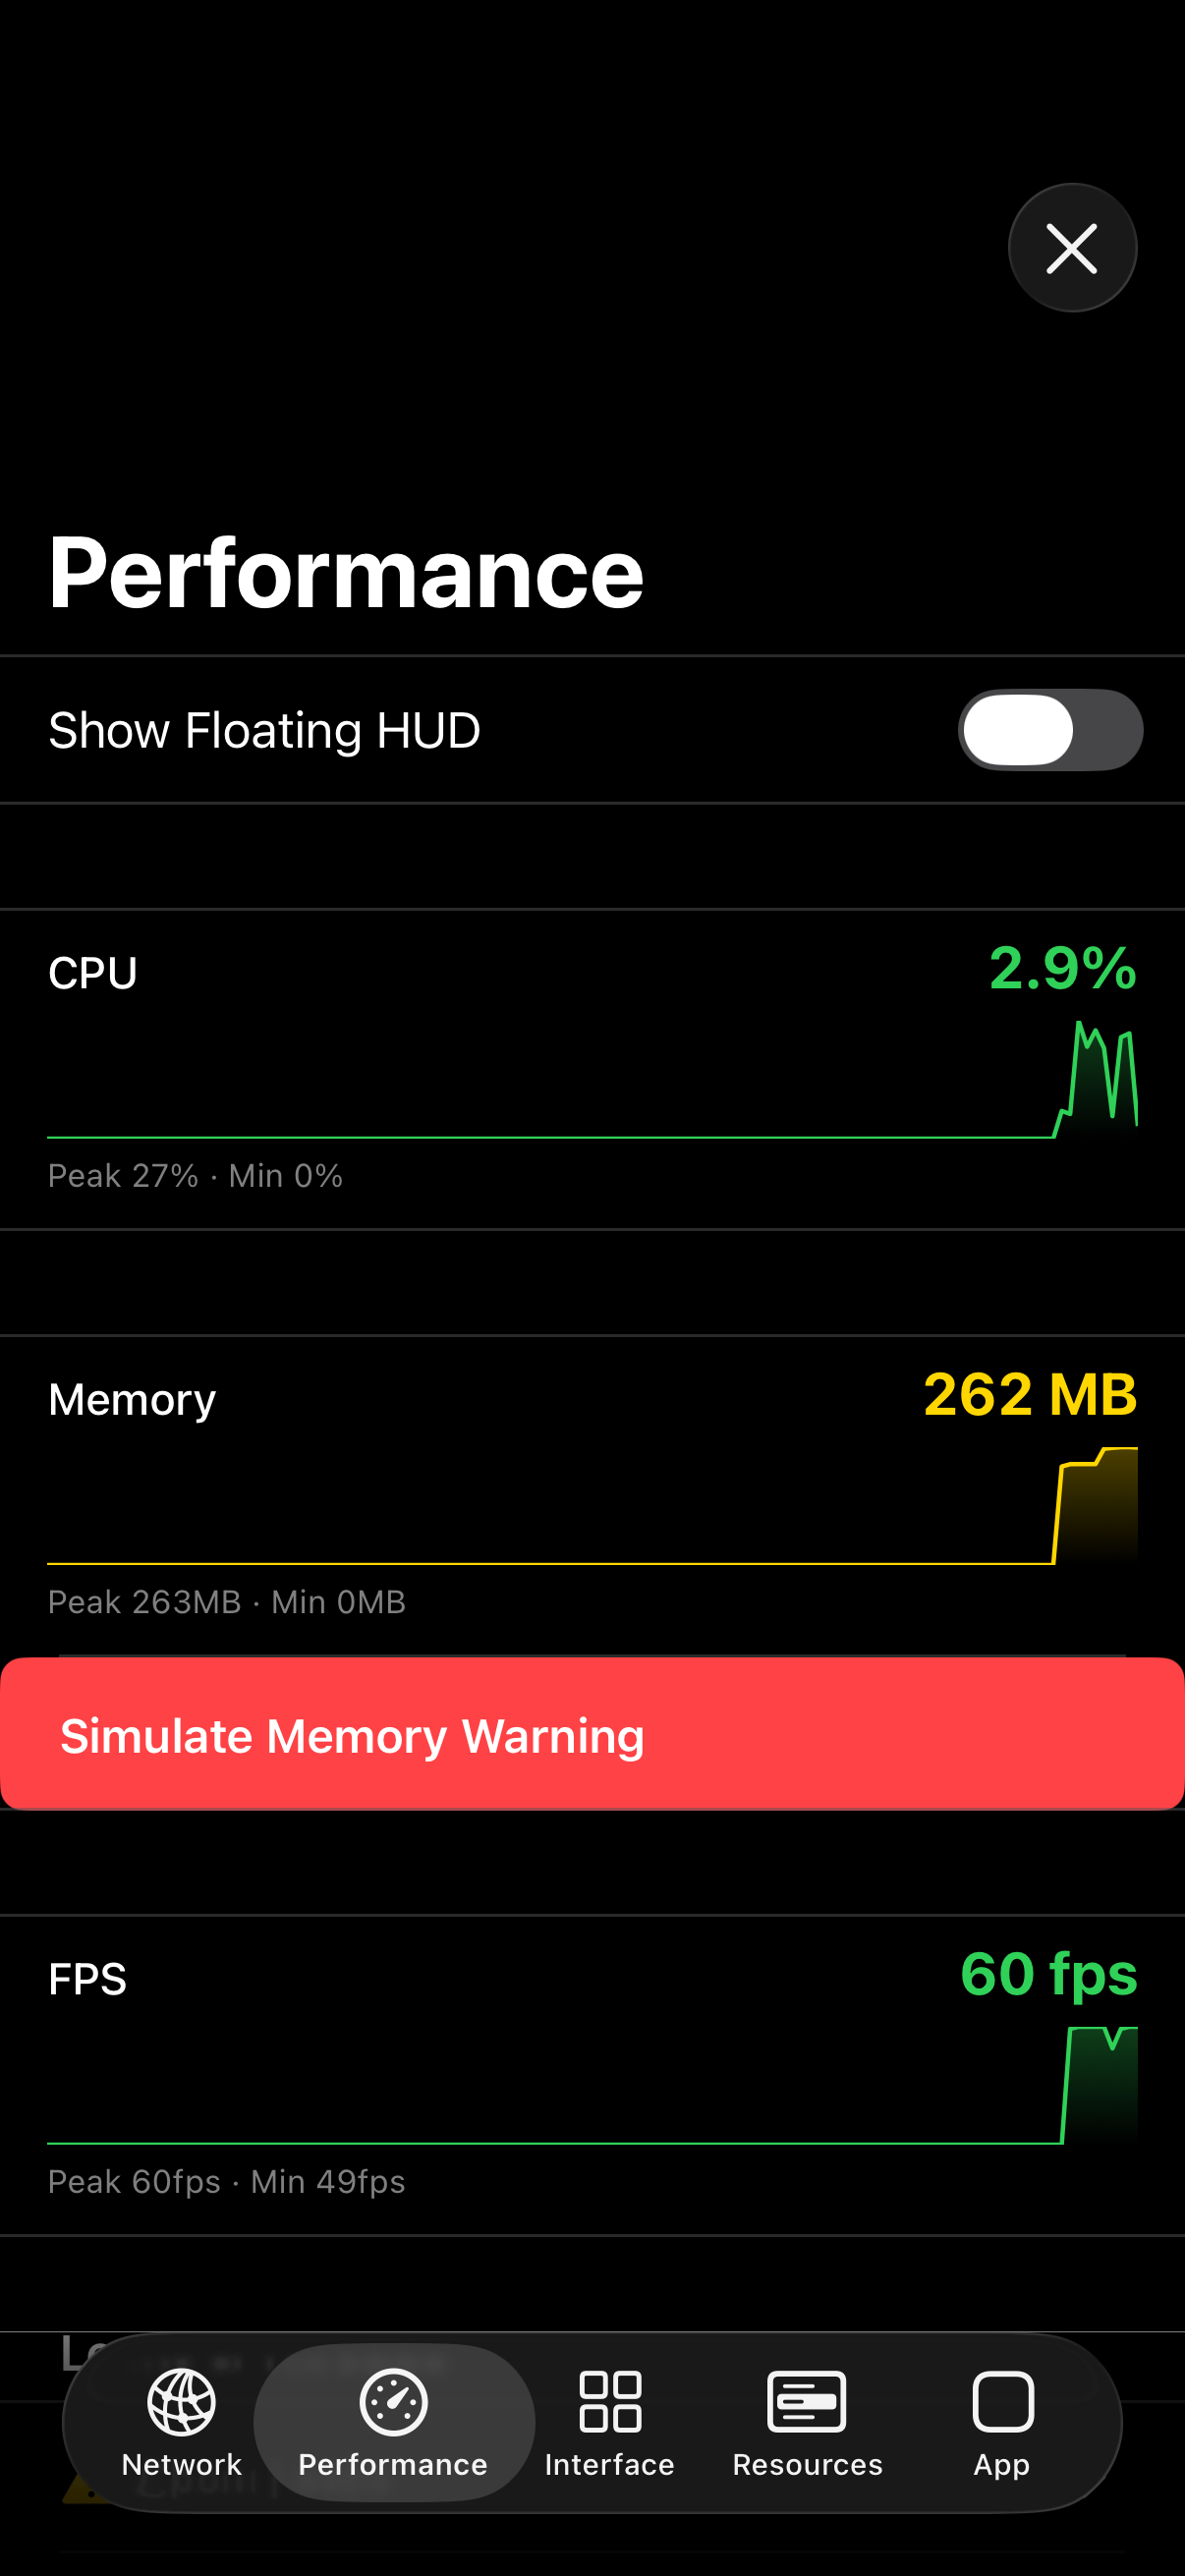
Performance
CPU, memory, FPS, leak detection, and thread checker.
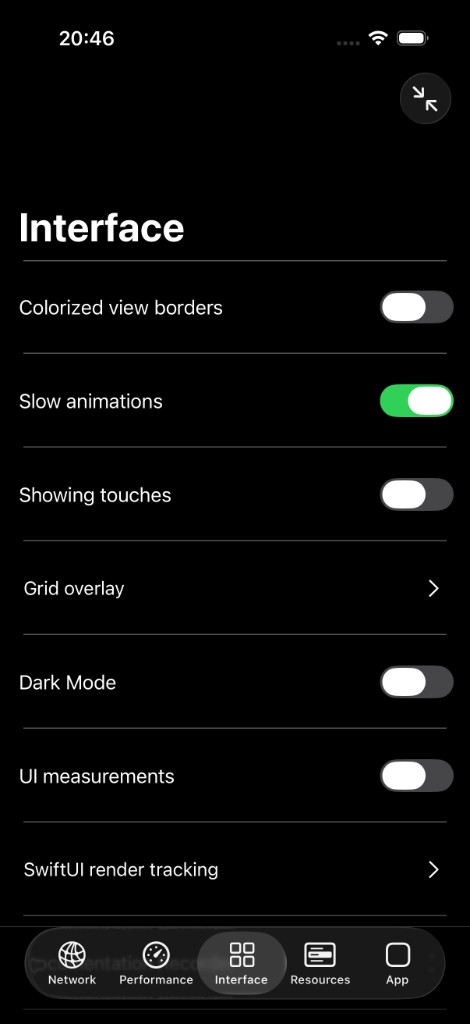
Interface Tools
View hierarchy, grid overlay, render tracking, doc recorder.
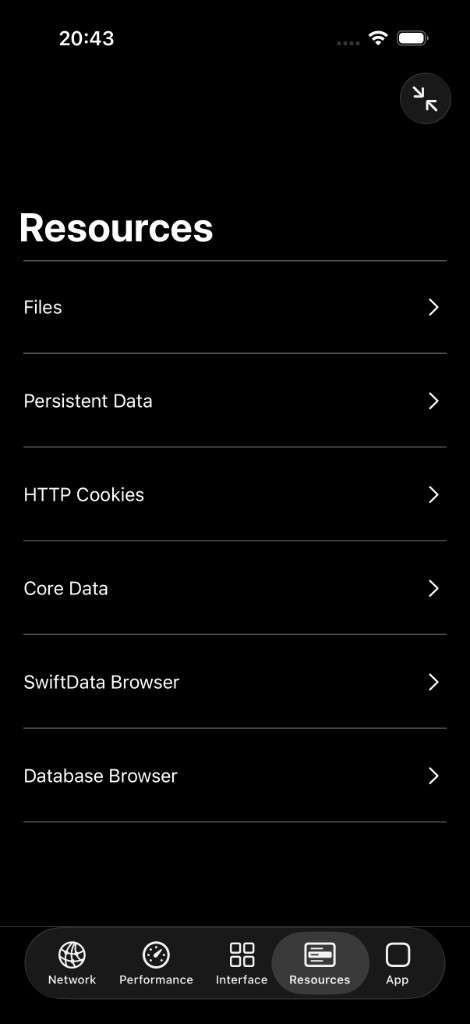
Resources
UserDefaults, Keychain, SQLite, Realm, SwiftData, file browser.
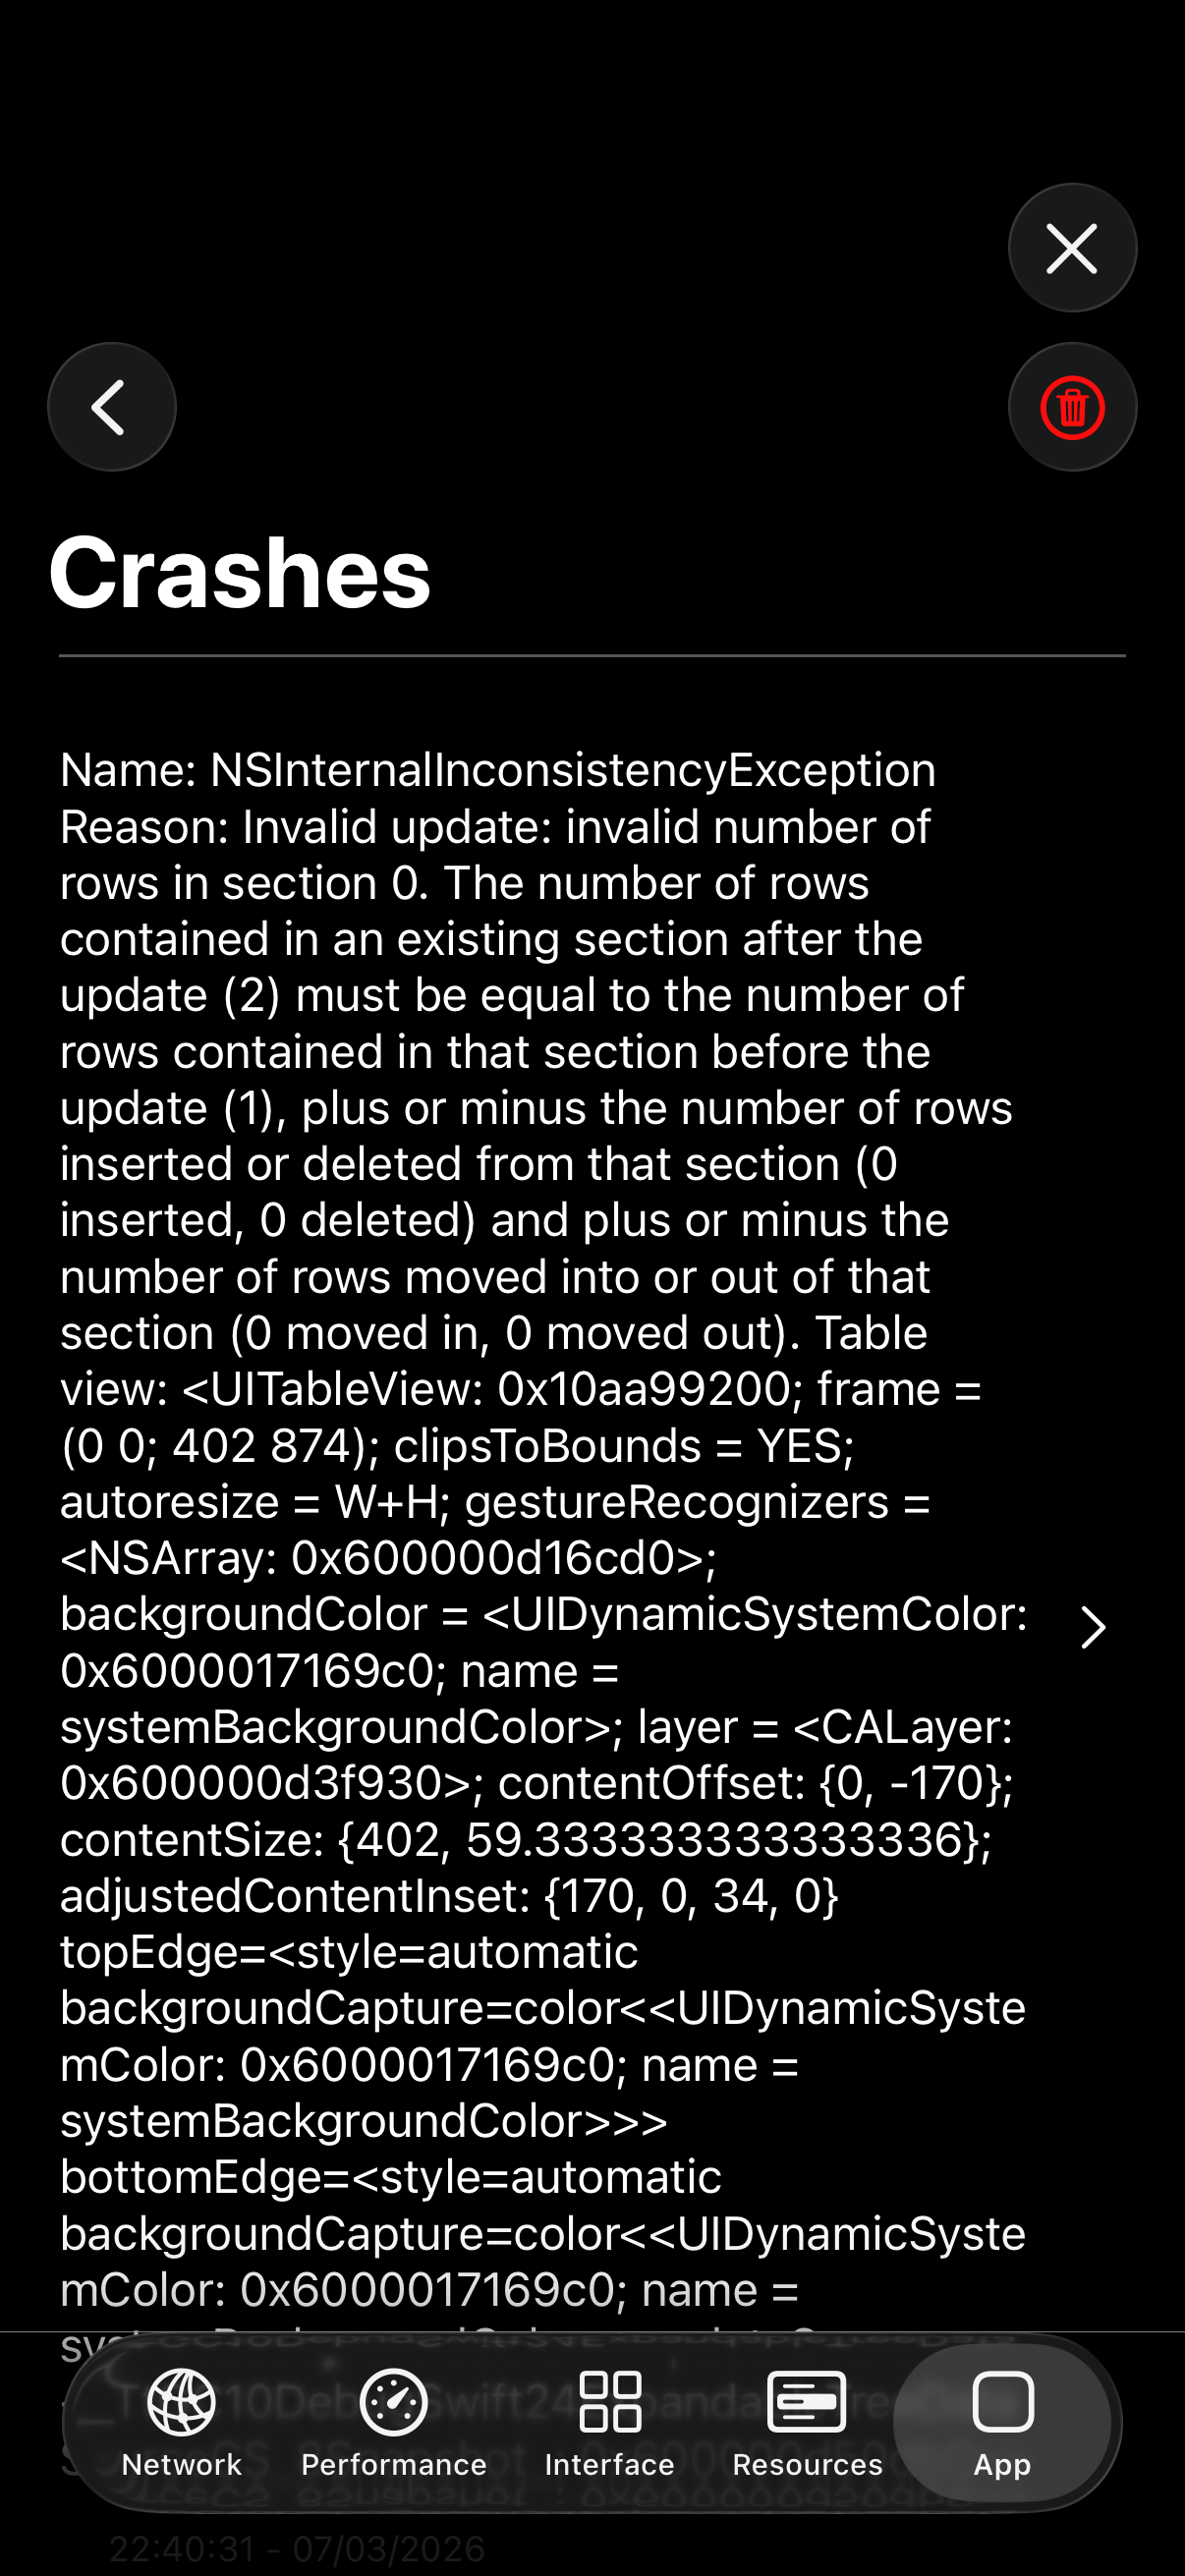
App Tools
Crash reports, console logs, device info, APNS tokens, and custom actions.
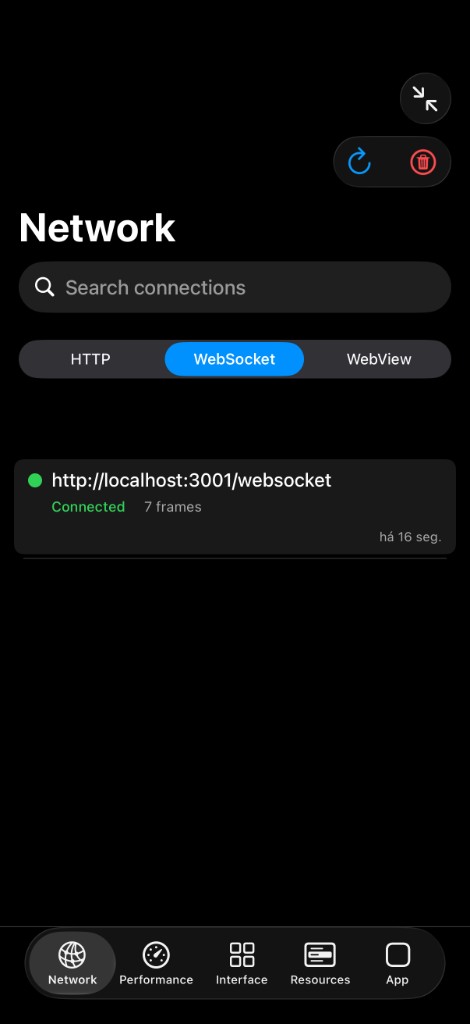
WebSocket Inspector
Live connection list and frame capture for URLSessionWebSocketTask.
What people are saying
Swift developers using DebugSwift in their daily workflow.
Three steps to your first capture
Add package
SPM or CocoaPods. DEBUG builds only.
Call setup()
One line in AppDelegate. Optional shake gesture.
Tap the ball
Floating debugger appears over your running app.
Debug locally. Ship with proof.
Open source, MIT licensed, and built for Swift teams who want one debugger in every DEBUG build.