Everything you need to debug iOS apps
One floating toolkit covering network, performance, UI, crashes, and sandbox resources — all inside your running app.
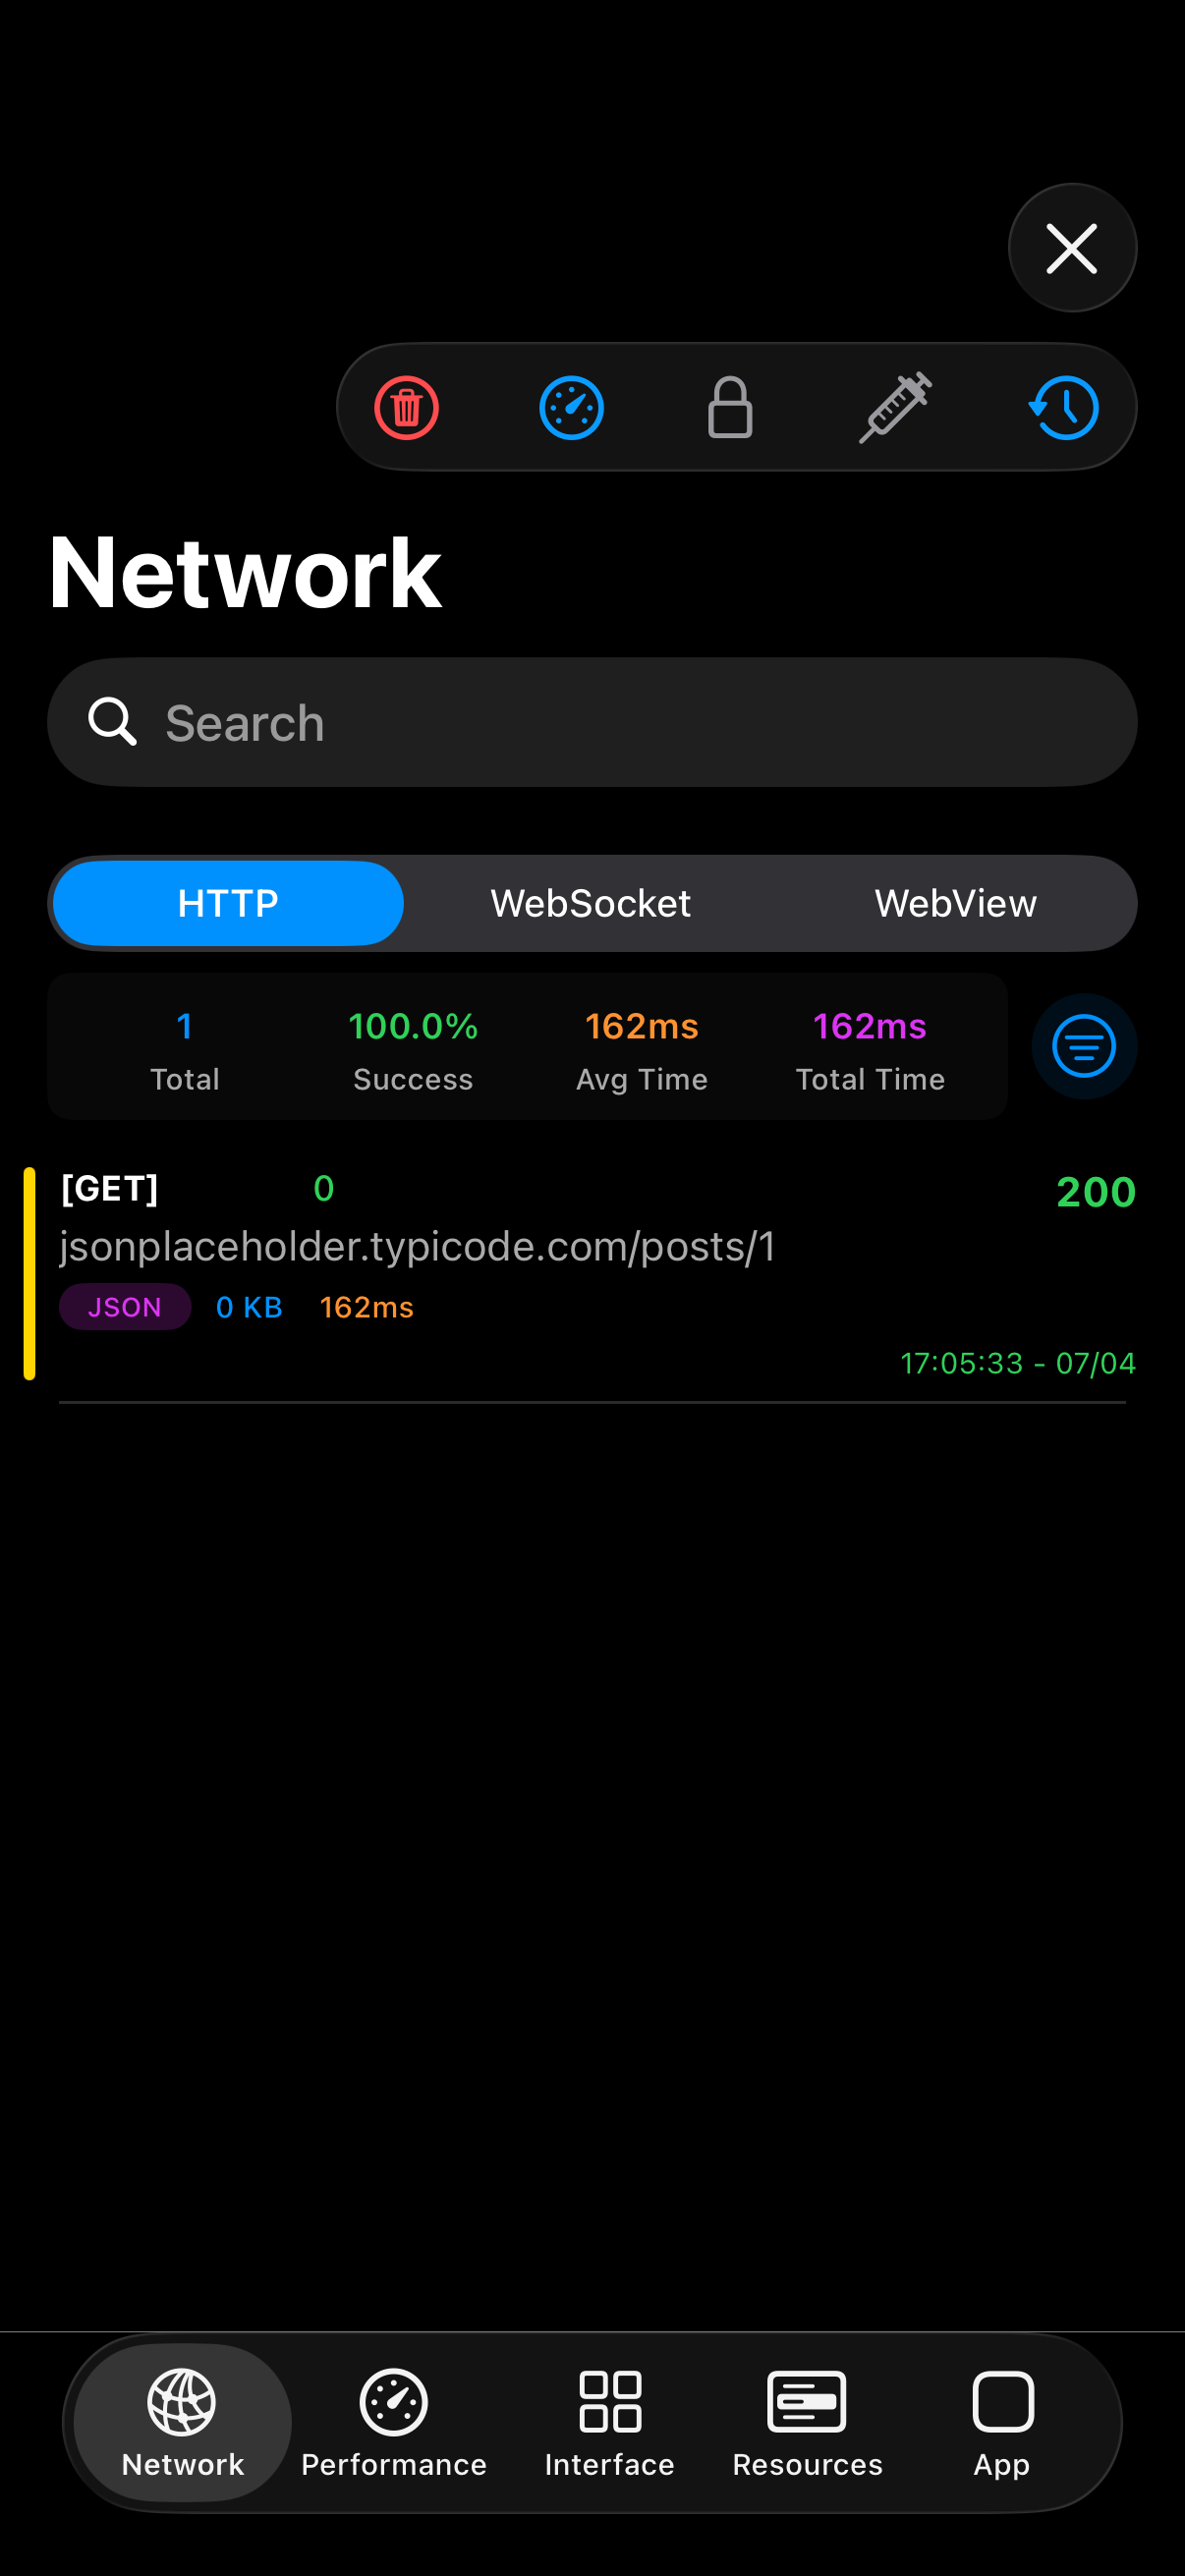

Network Inspector
Capture HTTP and WebSocket traffic in-process. Decrypt responses, rewrite payloads, and set thresholds without a proxy or certificate install.
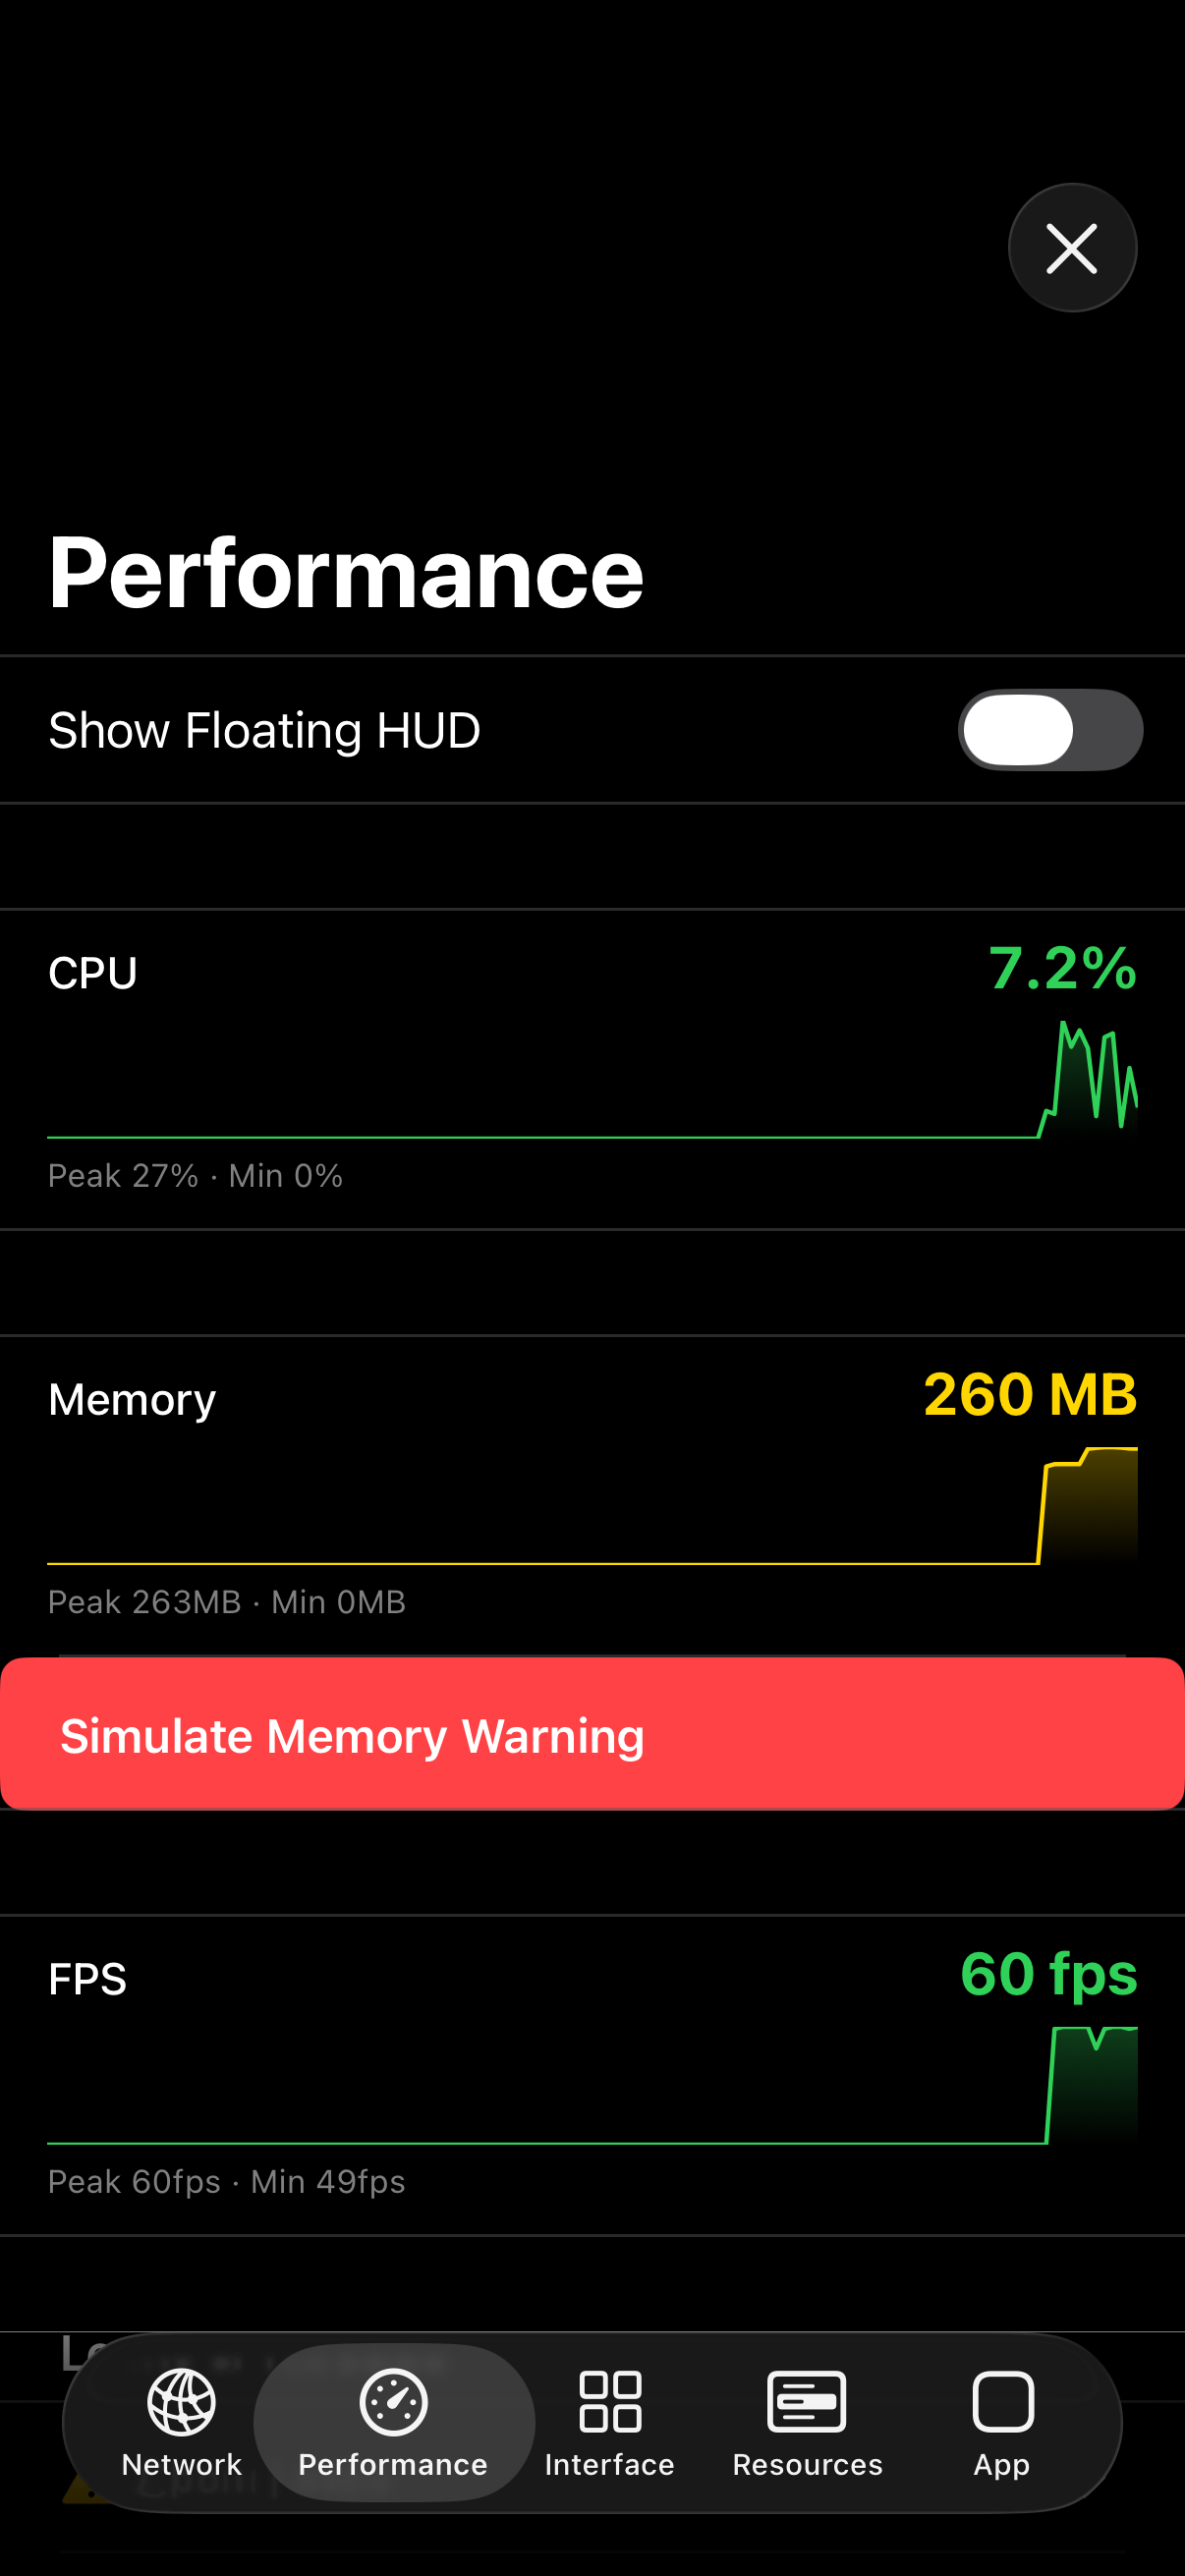
Performance
Watch CPU, memory, and FPS in real time. Catch leaked view controllers, main-thread violations, and overlay a live metrics widget on your UI.
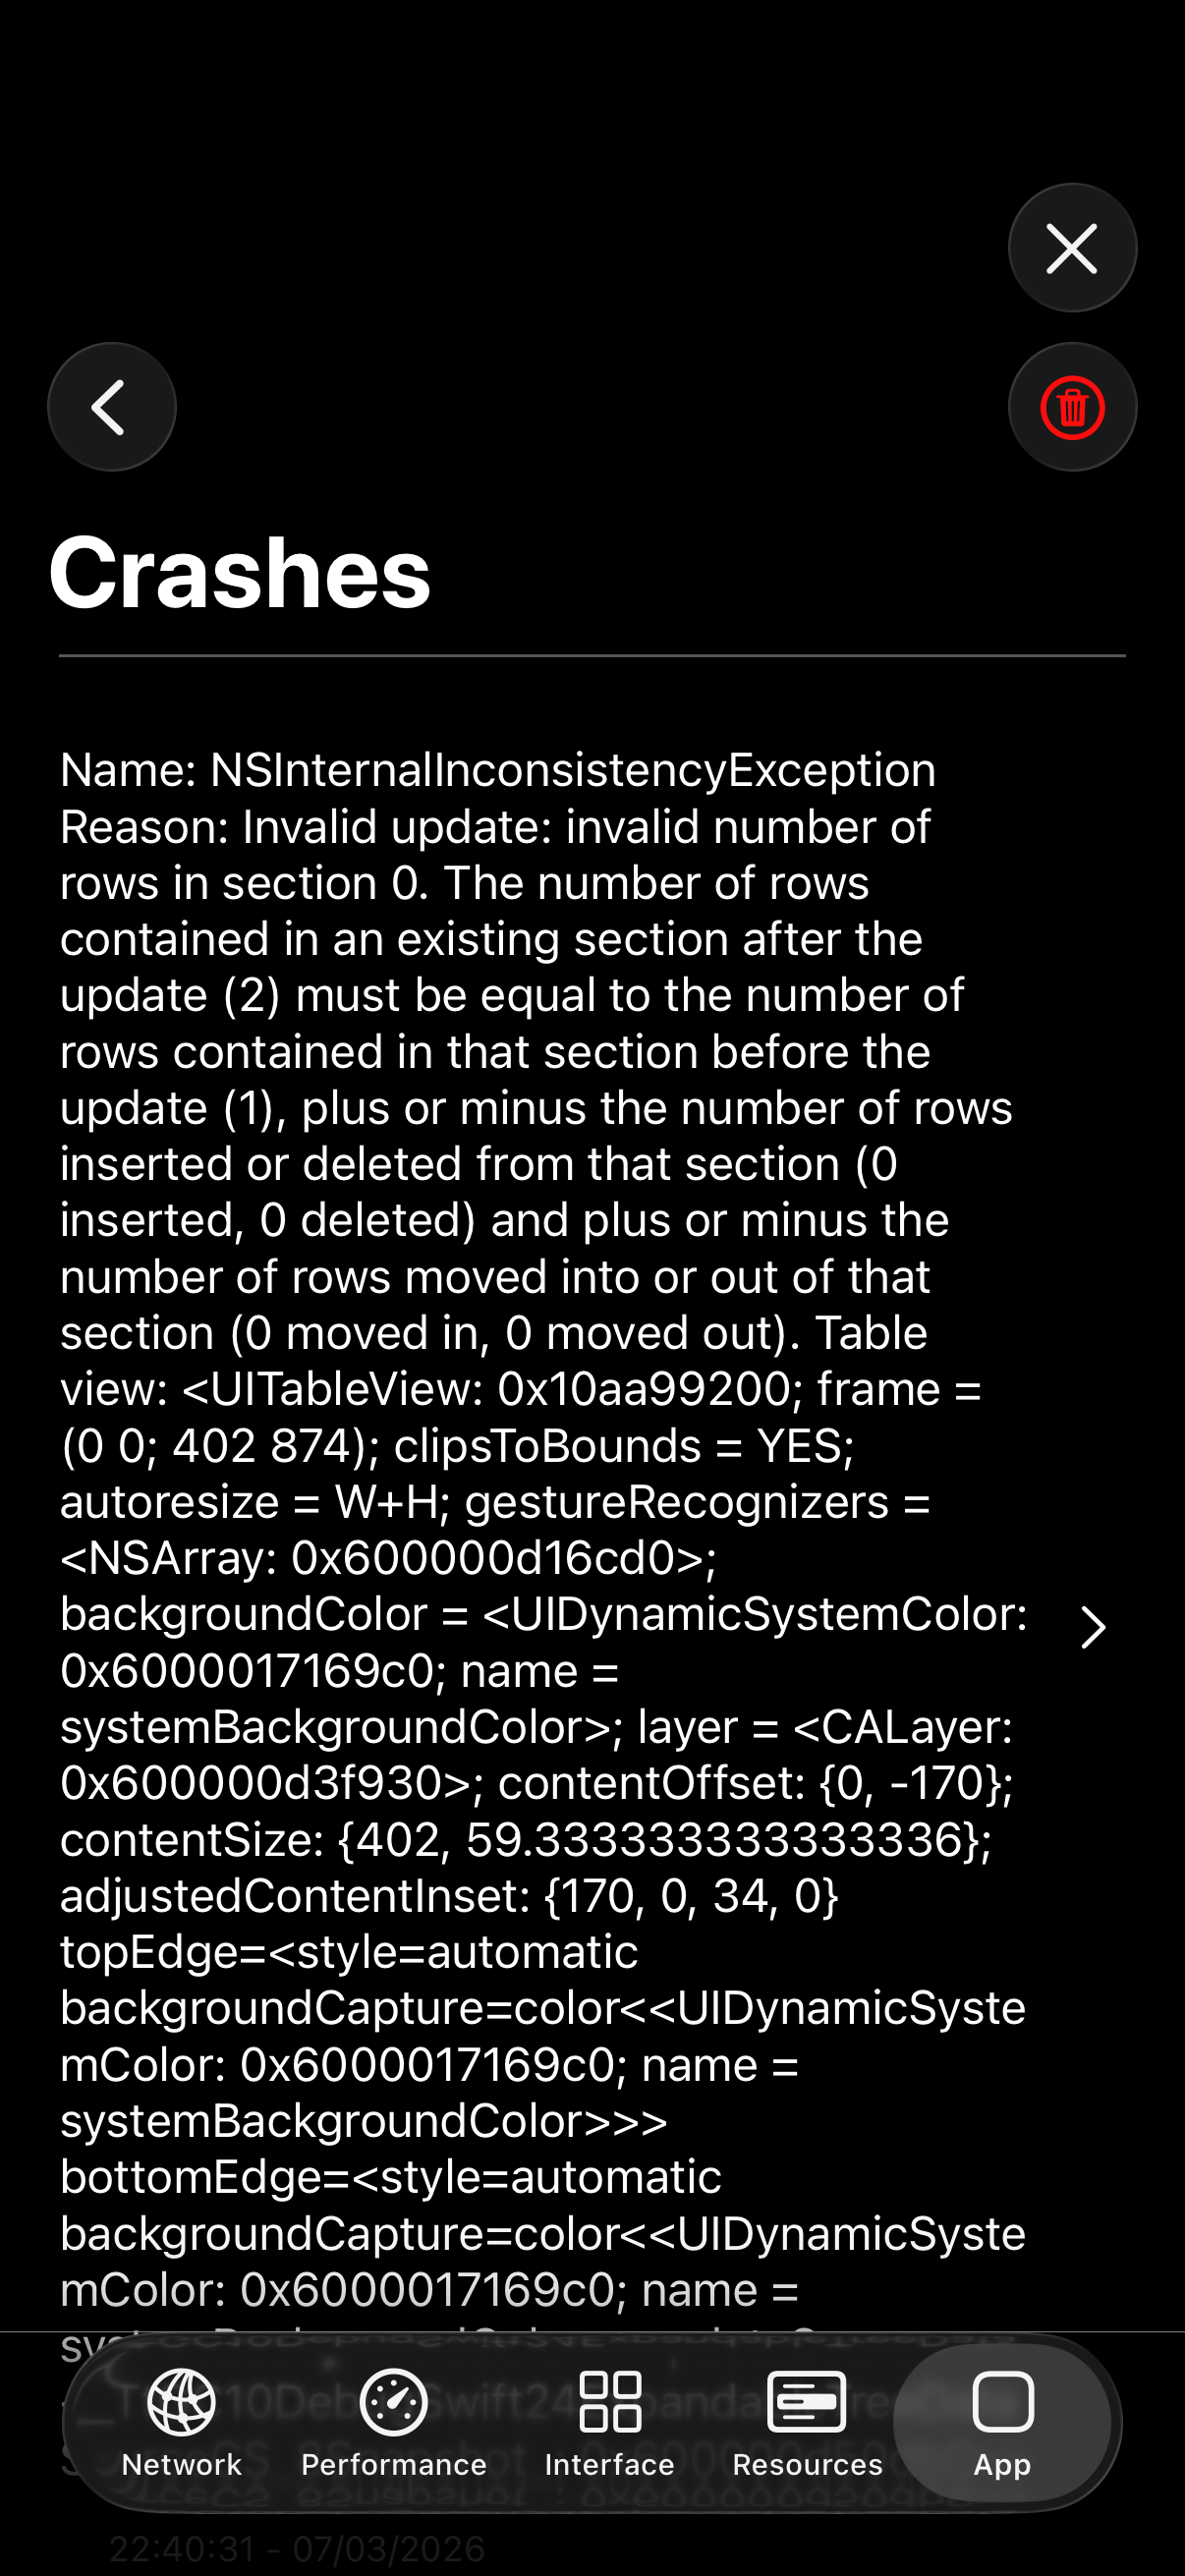
App Tools
Crash reports with screenshots, live console output, device and build info, push tokens, and custom actions your team registers at runtime.
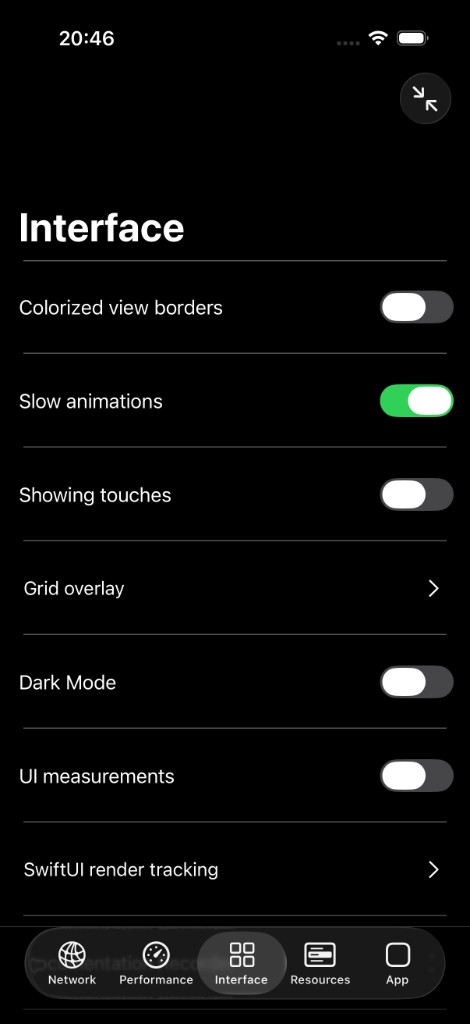
Interface Tools
Inspect view hierarchies in 3D, overlay grids and borders, slow down animations, track SwiftUI renders, and record annotated screenshots for QA.
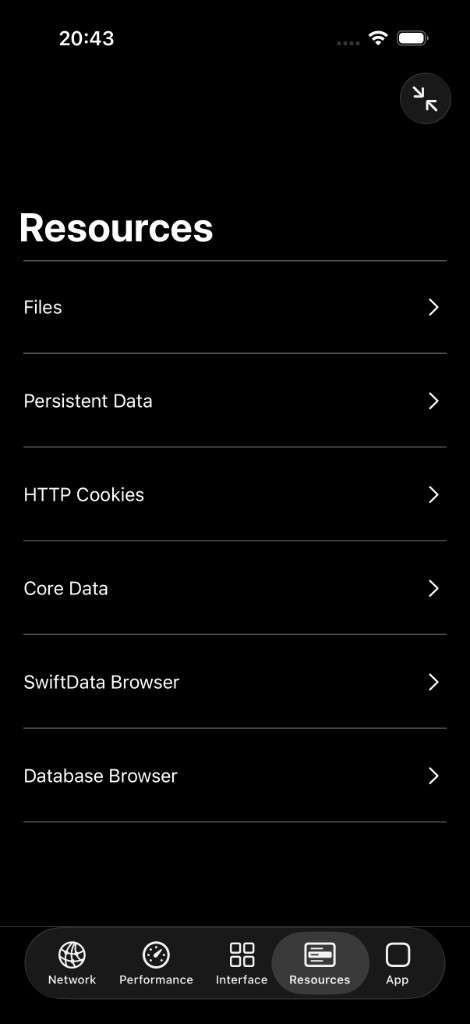
Resources
Browse sandbox files, UserDefaults, Keychain entries, SQLite and Realm databases, SwiftData models, and simulate push notifications in-app.
Debug inside your app. Ship with confidence.
Open-source in-app debugging toolkit for iOS. Inspect network traffic, monitor performance, browse resources, and debug UI, all from a floating overlay inside your app.