Real-time Metrics
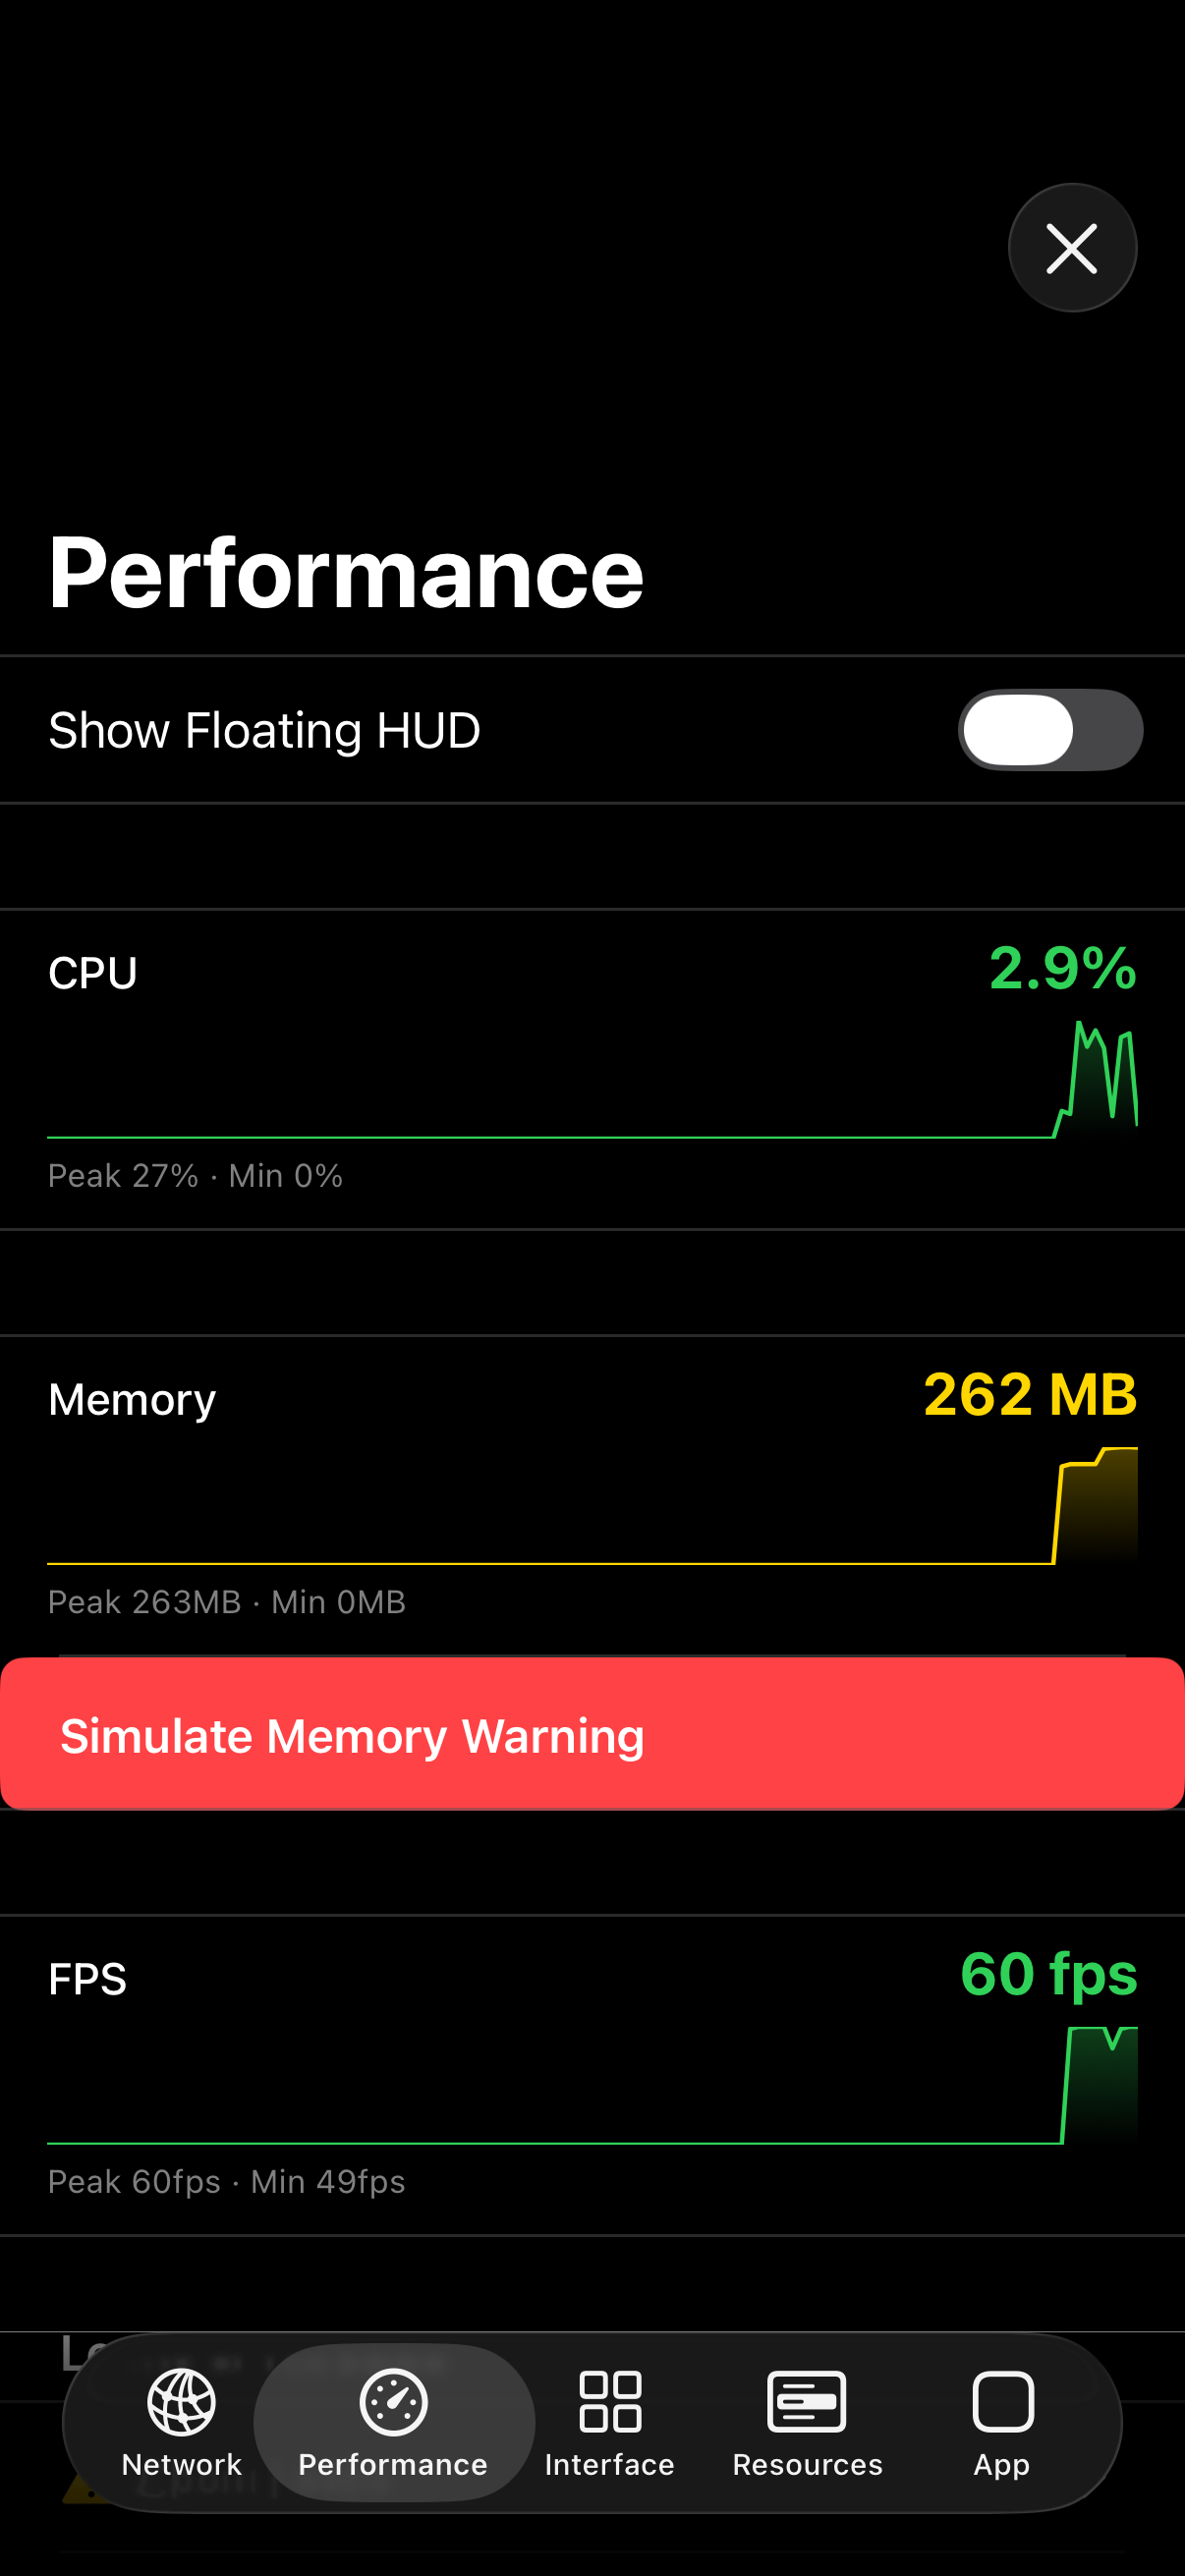
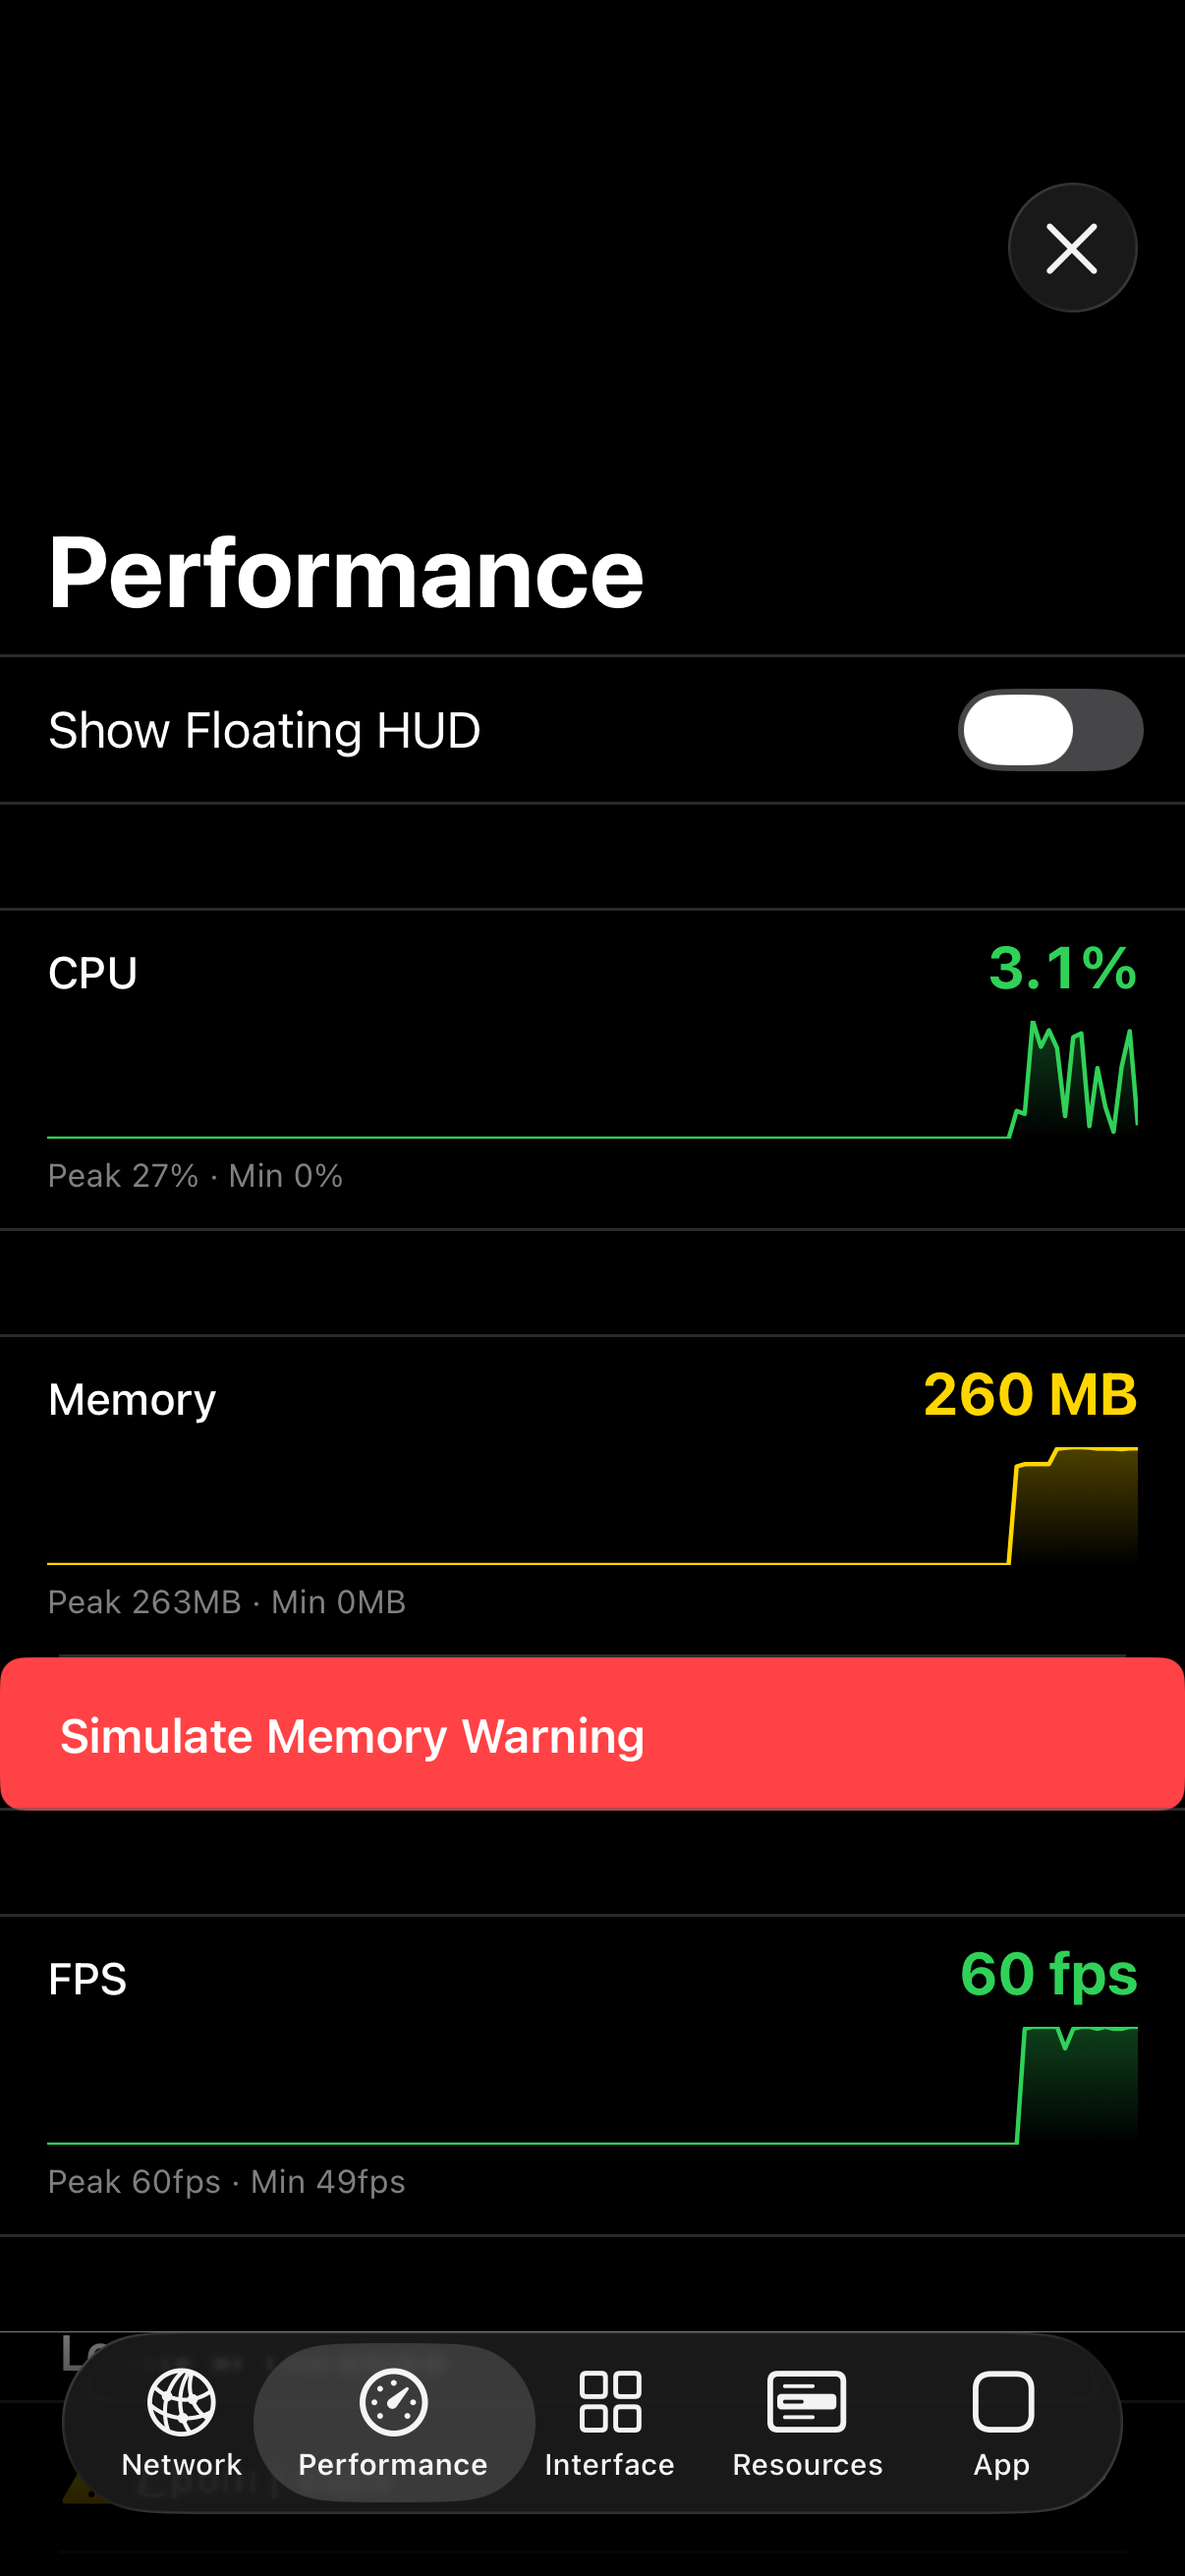
Monitor CPU, memory, and FPS with live charts inside the Performance tab.
The Performance tab shows CPU usage, memory footprint, and frame rate updated in real time. Use it to spot regressions while navigating your app.

What each metric tells you
- CPU — main thread and total process usage
- Memory — resident and allocated heap size
- FPS — frames per second with drop detection
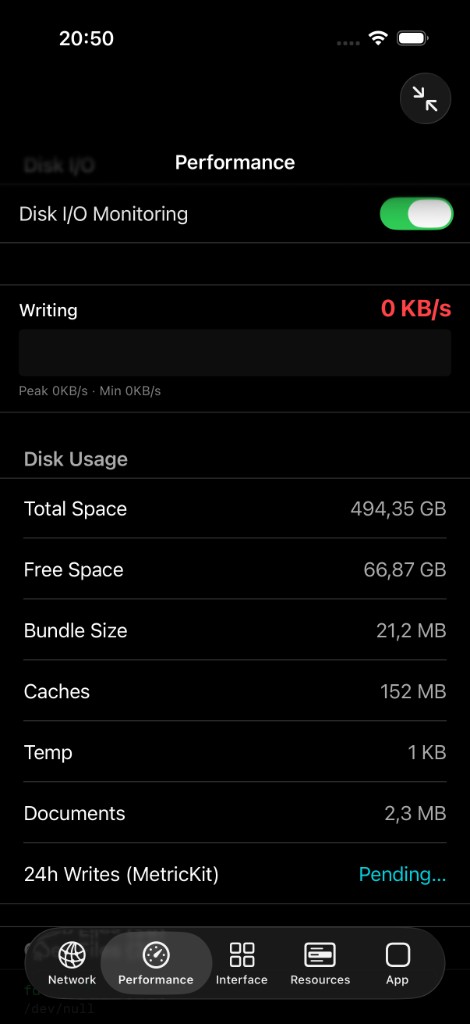
Disk I/O and usage
Enable Disk I/O Monitoring to watch live read and write throughput, then review on-device storage breakdown: bundle size, caches, temp files, and Documents. MetricKit 24-hour write totals appear when available.
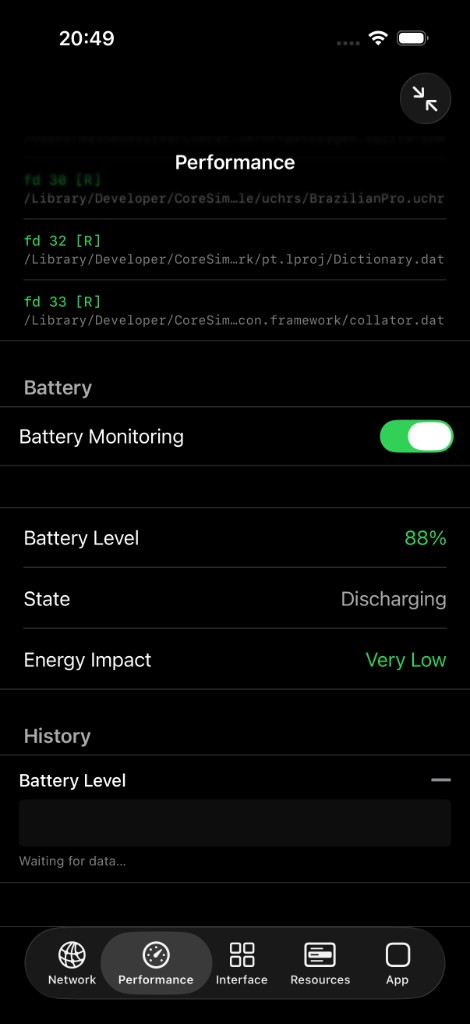
Battery monitoring
Scroll the Performance tab to inspect open file descriptors, then enable Battery Monitoring to track level, charging state, and energy impact over time. On device, readings update from UIDevice; the simulator uses mock data when battery APIs are unavailable.