Overview
DebugSwift is an open-source in-app debugging toolkit for iOS. Inspect network traffic, monitor performance, browse sandbox resources, and debug UI — all from a floating overlay inside your running app.
Everything runs locally inside your DEBUG build. DebugSwift captures URLSession traffic, WebSocket frames, performance metrics, and sandbox state without a proxy, certificate trust step, or external desktop tool.

What DebugSwift Helps You Do
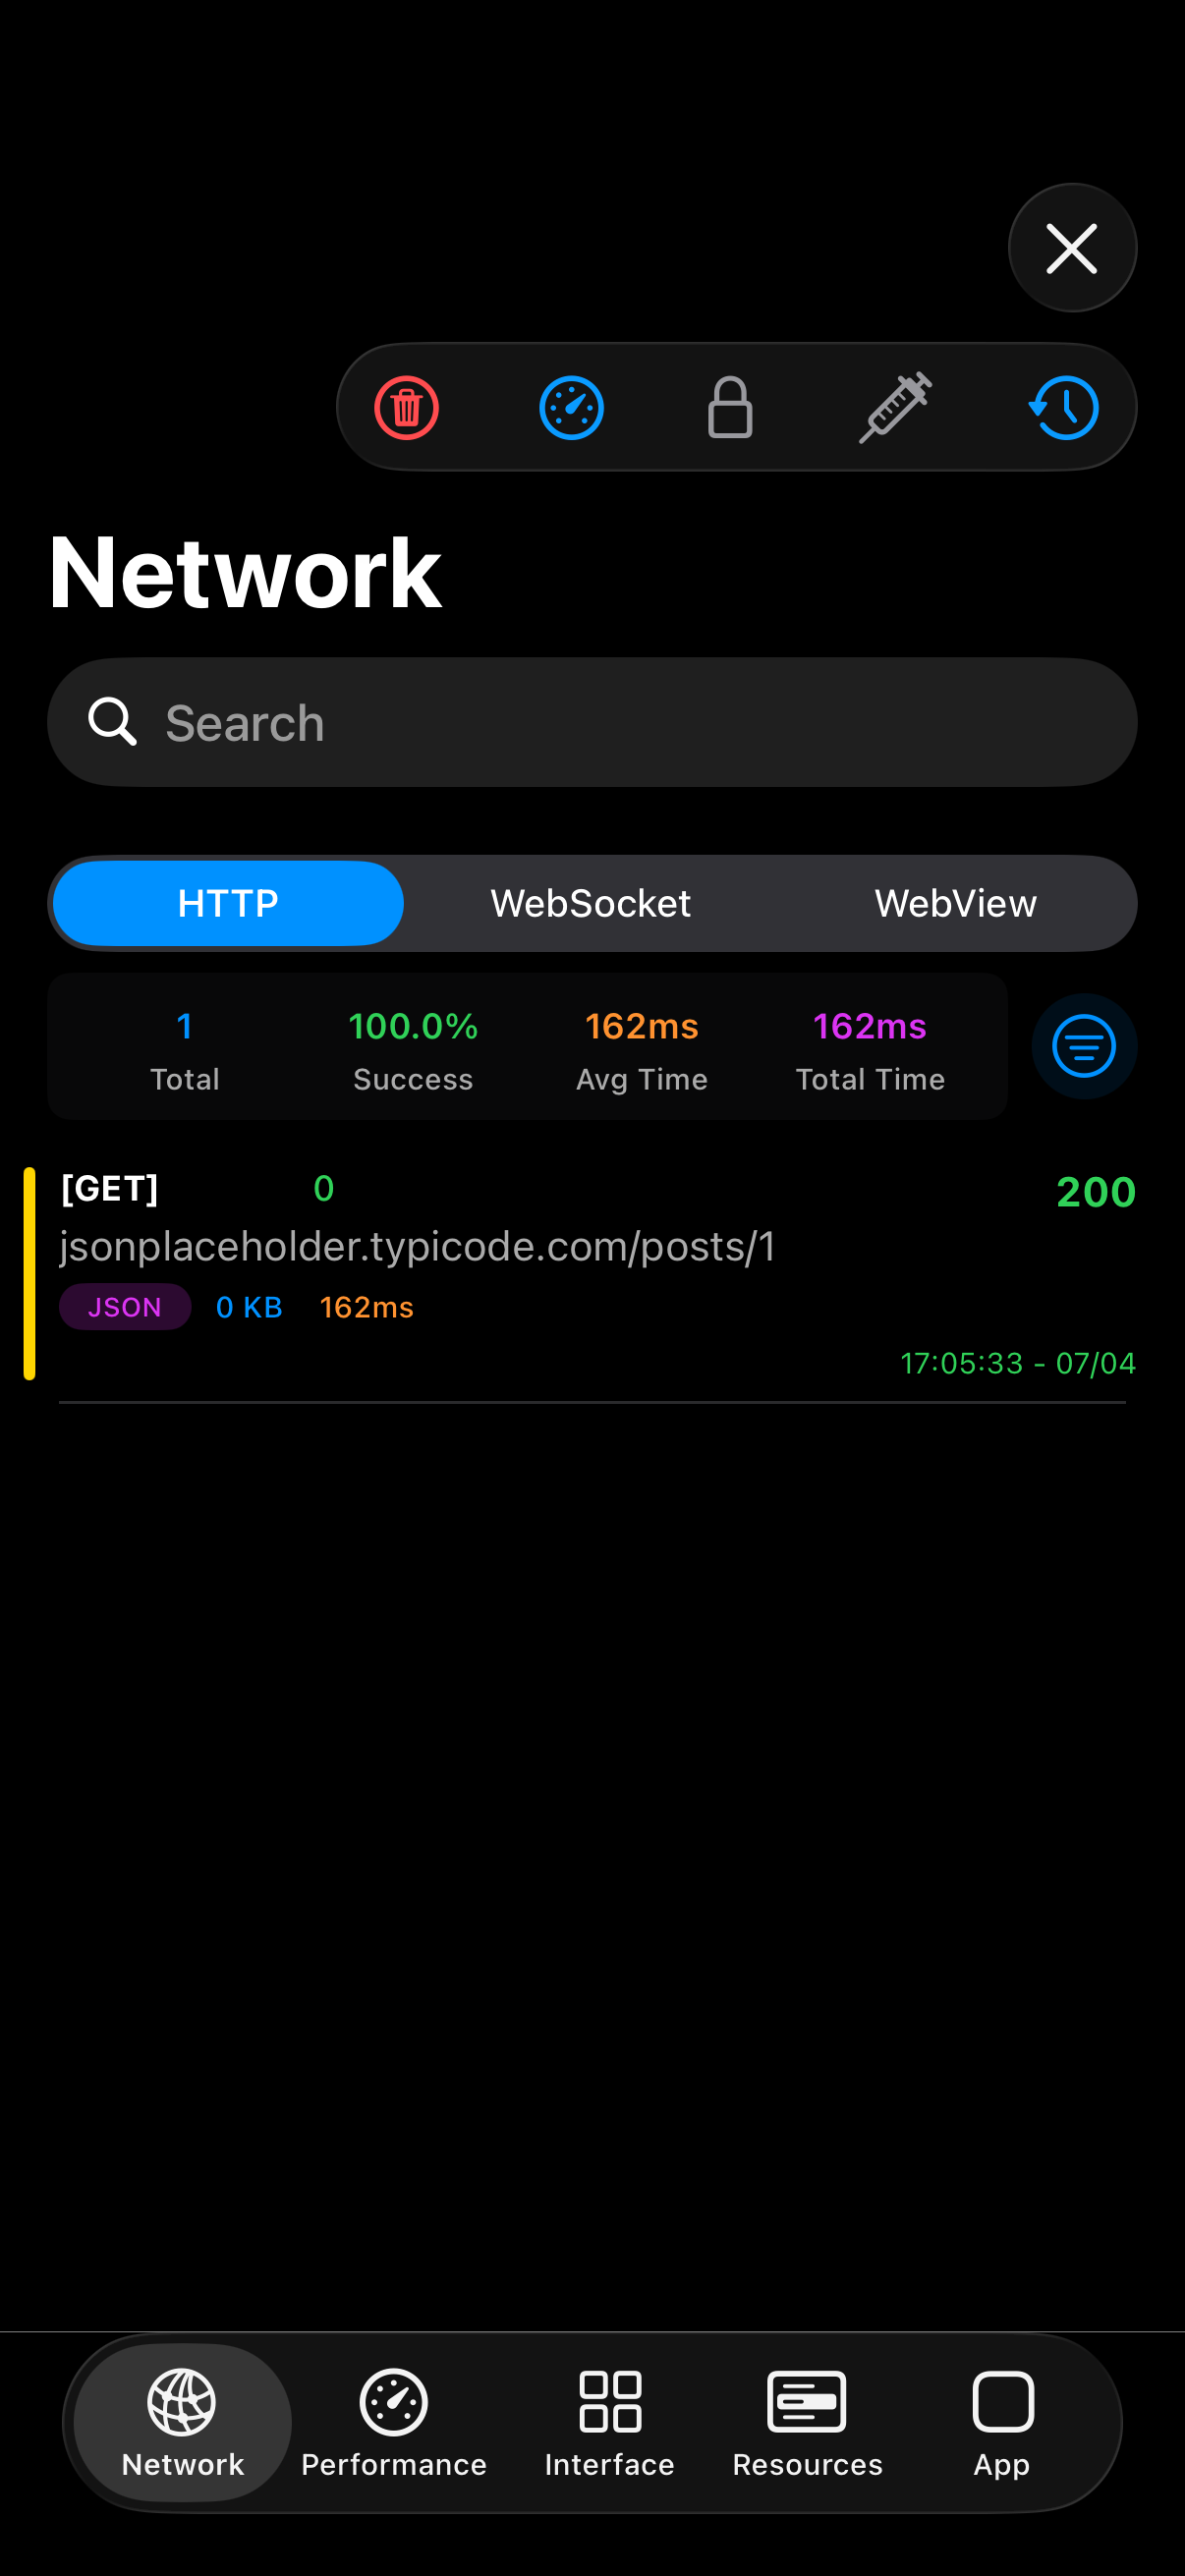
Inspect network traffic in-app
Capture URLSession requests and responses, WebSocket frames, and encrypted payloads from the simulator or device — no proxy setup.
Debug API calls faster
Mock responses with rules, decrypt encrypted bodies, and filter session history without leaving your running app.
Monitor performance live
Track CPU, memory, FPS, memory leaks, and main-thread violations with real-time charts and overlays.
Browse sandbox resources
Inspect UserDefaults, Keychain, databases, files, and SwiftData models at runtime from one toolkit.
Core Workflows
Capture and inspect traffic
DebugSwift hooks URLSession automatically after setup(). Every request and response appears in the Network tab with headers, body, timing, JSON highlighting, and optional decryption for encrypted payloads.
Modify and mock responses
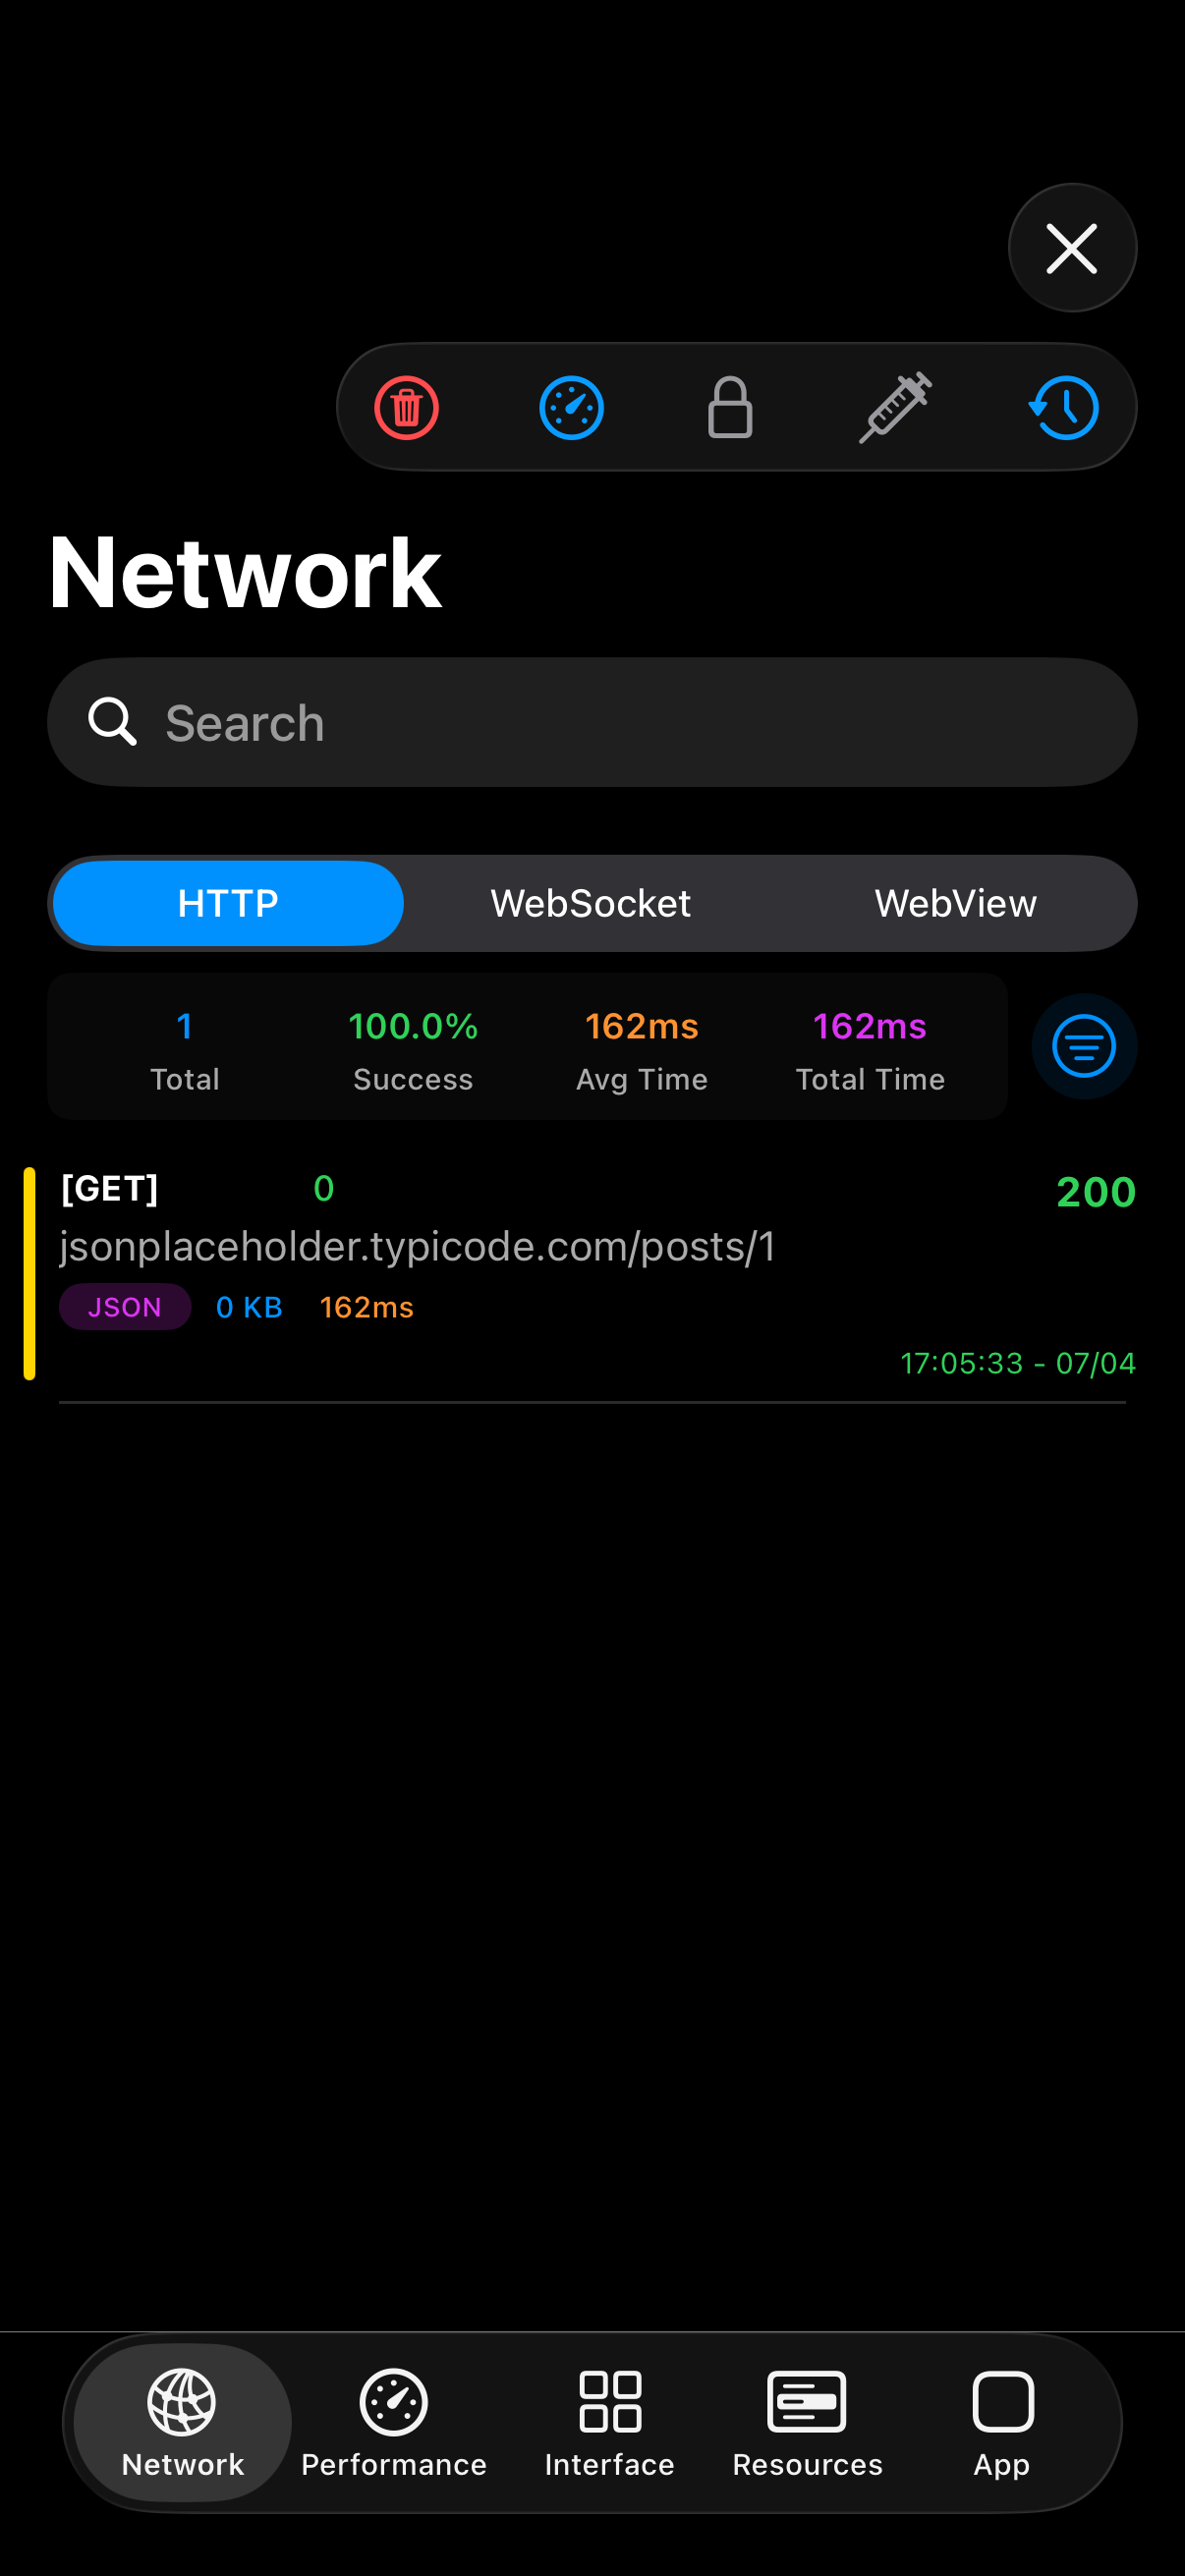
Use the Response Modifier to rewrite status codes and bodies based on URL patterns. Import rules from CSV, edit in a body editor, or generate rules from live captured traffic — no backend changes required.
Debug performance and UI
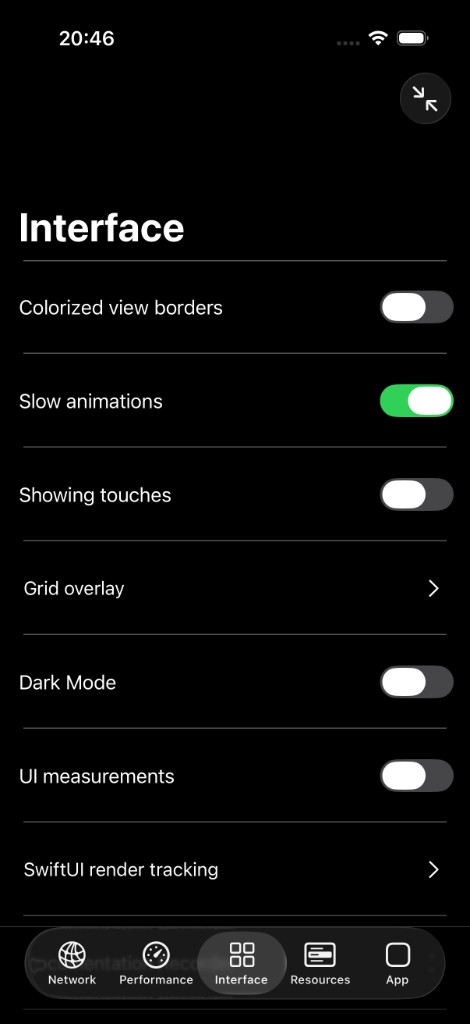
Track CPU, memory, and FPS with the performance overlay. Detect leaked view controllers and SwiftUI views. Inspect the 3D view hierarchy, slow down animations, and record annotated screenshots for QA handoffs.
Browse app resources
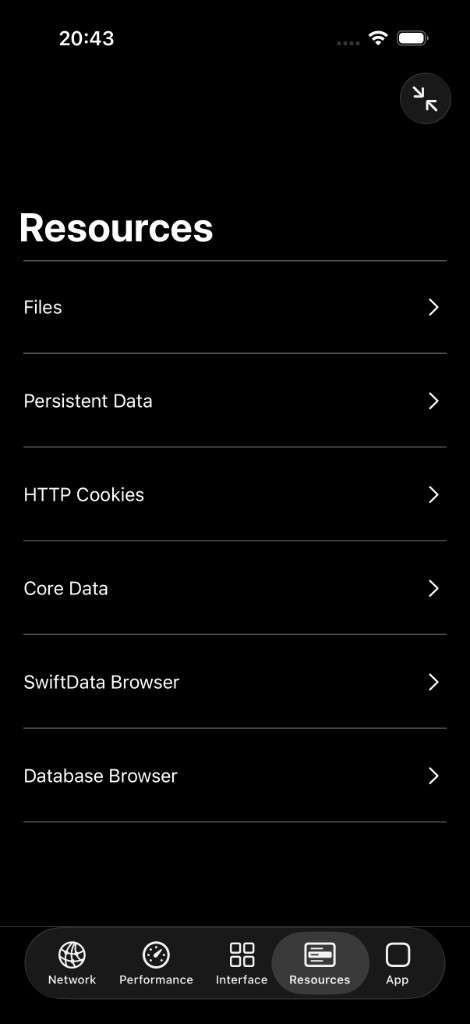
Navigate the sandbox, inspect and edit UserDefaults, browse Keychain entries, query SQLite and Realm databases, and explore SwiftData models on iOS 17+.
Read This First
- Quick Start — install, call setup(), and open the debugger in under two minutes
- Installation — SPM, CocoaPods, XCFramework, and Apple Silicon notes
- Configuration — network filters, selective feature disable, and custom actions
- First Debug Session — verify network capture, performance overlay, and resource browsers
Positioning
- In-app iOS debugging toolkit (not a macOS system proxy)
- Zero proxy or certificate setup for URLSession traffic
- MIT licensed, fully open source, no account required
- DEBUG builds only — never ship to App Store releases
System Requirements
- iOS 14.0 or later
- Swift 6.0+
- Xcode 16.0+
- Apple Silicon or Intel Mac for development