
WebSockets power live feeds, chat, collaborative editing, and real-time notifications. Debugging them is painful: browser DevTools cover WKWebView only partially, proxies often struggle with upgraded connections, and raw logging with print statements loses frame boundaries. If your iOS app uses URLSessionWebSocketTask — Apple's first-party WebSocket API since iOS 13 — DebugSwift captures every connection and frame with zero configuration beyond setup().
What gets captured automatically
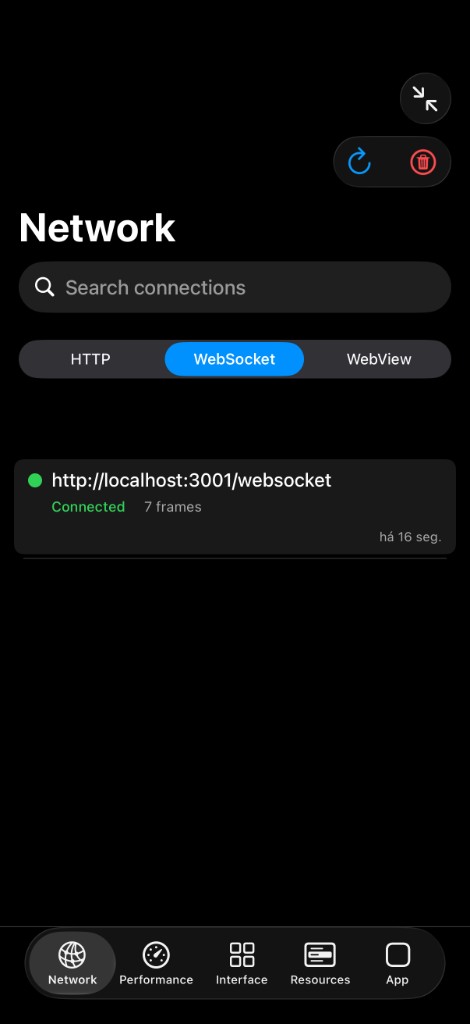
DebugSwift's WebSocket monitor hooks URLSessionWebSocketTask at runtime. New connections appear in a dedicated WebSocket tab, separate from HTTP traffic. Each connection shows open, message, and close events with timestamps.

Frame inspection
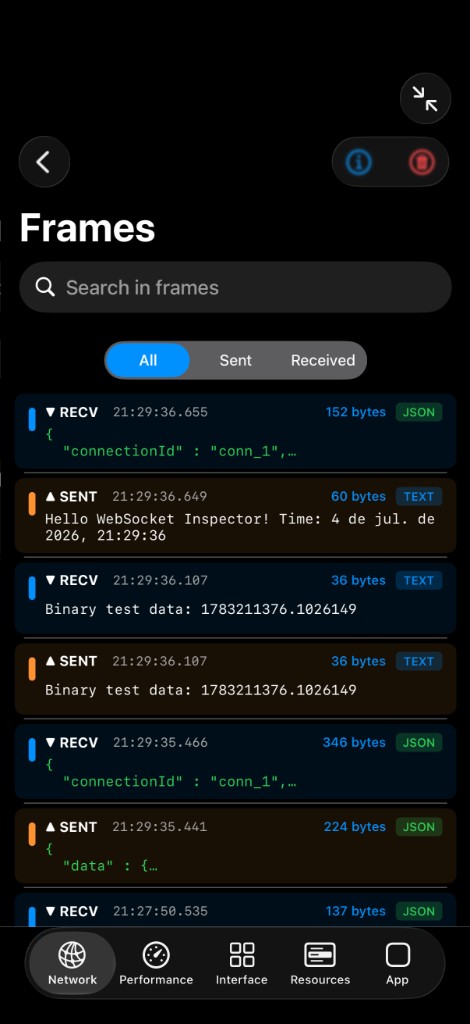
- Text frames displayed as readable strings
- Binary frames shown with size and hex preview
- Direction indicators — client-to-server vs server-to-client
- Per-connection message history for replaying conversation flow
- Connection errors and close codes when handshakes fail
No manual registration
Unlike some debugging libraries that require you to wrap each WebSocket instance or register delegates, DebugSwift enables WebSocket capture globally in setup(). If you did not disable it with setup(disable: [.webSocket]), frames flow into the inspector automatically.
// WebSocket capture is on by default after setup()
let debugSwift = DebugSwift()
debugSwift.setup()show()

// Clear history when switching environments
await DebugSwift.Network.shared.clearWebSocketHistory()
What is not covered
URLSessionWebSocketTask is the supported path. Third-party WebSocket libraries that use raw NWConnection or Starscream's own socket layer bypass URLSession and will not appear unless they ultimately route through a monitored API. WKWebView WebSockets are handled separately via the WKWebView network monitor. If a connection is missing, check which stack your library uses.
Debugging workflow
Reproduce the real-time feature in your app — open a chat channel, subscribe to a feed, trigger a push over WS. Switch to the WebSocket tab, select the connection, and walk through frames in order. Compare client requests against server responses to spot missing acknowledgments, duplicate subscriptions, or JSON parse errors in message payloads. Pair with the HTTP tab when your app uses REST for auth and WebSockets for streaming on the same host.