Memory leaks in iOS apps are rarely dramatic. They do not crash immediately. They accumulate — a view controller that never deallocates after pop, a closure that captures self strongly, a notification observer left registered. Over a long session the footprint grows, scroll performance degrades, and eventually iOS jetsams your app. Catching these leaks early means watching object lifecycles, not just peak memory on a chart.
Why view controller leaks matter most
UIViewController instances anchor large object graphs: their view hierarchies, child view controllers, presented sheets, and every object those views retain. When a controller survives a pop or dismiss, everything it owns survives with it. SwiftUI apps are not immune — UIHostingController and navigation wrappers still participate in UIKit lifecycle, and leaked hosting controllers keep entire SwiftUI trees alive.
How DebugSwift detects leaks
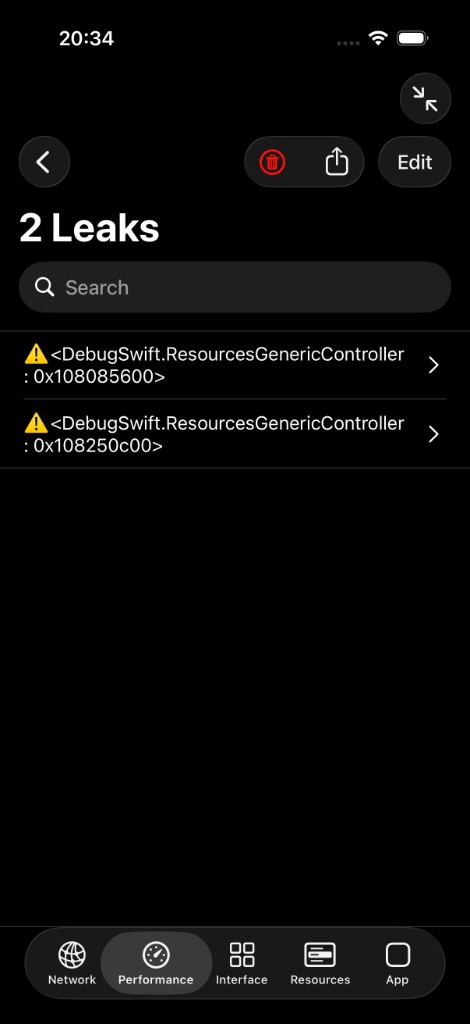
DebugSwift instruments UIViewController lifecycle methods at runtime. When you navigate into a screen and then pop back, the framework expects the controller to deallocate within a short window. If it survives, it appears in the Leaks tab with a retention path and stack trace pointing to where the object was created.

A practical workflow
- Enable leak detection via setup() — it is on by default unless you pass disable: [.leaksDetector]
- Navigate through your app normally: push, present, pop, dismiss
- Open the Performance tab and check Leaks after each flow
- Tap a leaked object to read the stack trace and find the retaining reference
- Fix the retain cycle, rerun the flow, and confirm the object disappears
Common SwiftUI and UIKit causes
- Closures in .onAppear or Task blocks that capture self without [weak self]
- Delegates declared as strong instead of weak
- NotificationCenter observers not removed in deinit
- Timer or CADisplayLink retaining the target
- Child view controllers added but never removed from parent
- Combine cancellables stored on a view model that outlives the view
Disabling when needed
Some APM SDKs install their own lifecycle swizzling — New Relic is a documented example. If you see conflicts, disable leak detection selectively while keeping other features:
debugSwift.setup(disable: [leaksDetector])Complementing Instruments
Xcode Instruments Leaks and Allocations remain the gold standard for deep memory profiling — finding malloc leaks, analyzing heap growth, and attaching to release builds. DebugSwift's leak detector is lighter-weight: it runs continuously during development, flags surviving view controllers without a separate Instruments session, and includes stack traces in the same overlay you use for network and UI debugging. Use both: DebugSwift for daily regression checks, Instruments when you need a full heap analysis.