Inspecting HTTPS traffic on iOS traditionally means standing up a man-in-the-middle proxy: generate a root CA, trust it on the simulator, route traffic through Charles or Proxyman, and hope certificate pinning does not block you. That workflow works — and for cross-app traffic on a Mac, it is often the right tool. For day-to-day iOS development inside your own app, in-process capture is faster and avoids the TLS trust dance entirely.
How proxy debugging works (and where it hurts)
A debugging proxy terminates TLS at the proxy machine. Your app connects to the proxy using a certificate signed by a locally trusted root CA; the proxy connects to the real server using the server's certificate. Traffic is decrypted in the middle, inspected, and re-encrypted. On macOS this is straightforward. On iOS you must install the root CA on each simulator or device, configure proxy settings, and handle apps that pin certificates — banking SDKs, some auth libraries, and security-hardened APIs will reject the proxy's certificate outright.
In-process capture with URLSession hooks
DebugSwift takes a different approach. After setup(), it swizzles URLSessionConfiguration factory methods so every session your app creates — including Alamofire, async URLSession, and third-party SDKs that use URLSession under the hood — flows through the same monitoring pipeline. Requests and responses are logged before encryption on the way out and after decryption on the way in. No certificate is substituted. Pinning continues to work because TLS still terminates inside your app's network stack.
let debugSwift = DebugSwift()
debugSwift.setup()show()

// Optional: filter noise or scope to your API
DebugSwift.Network.shared.ignoredURLs = ["https://analytics.example.com"]
DebugSwift.Network.shared.onlyURLs = ["https://api.myapp.com"]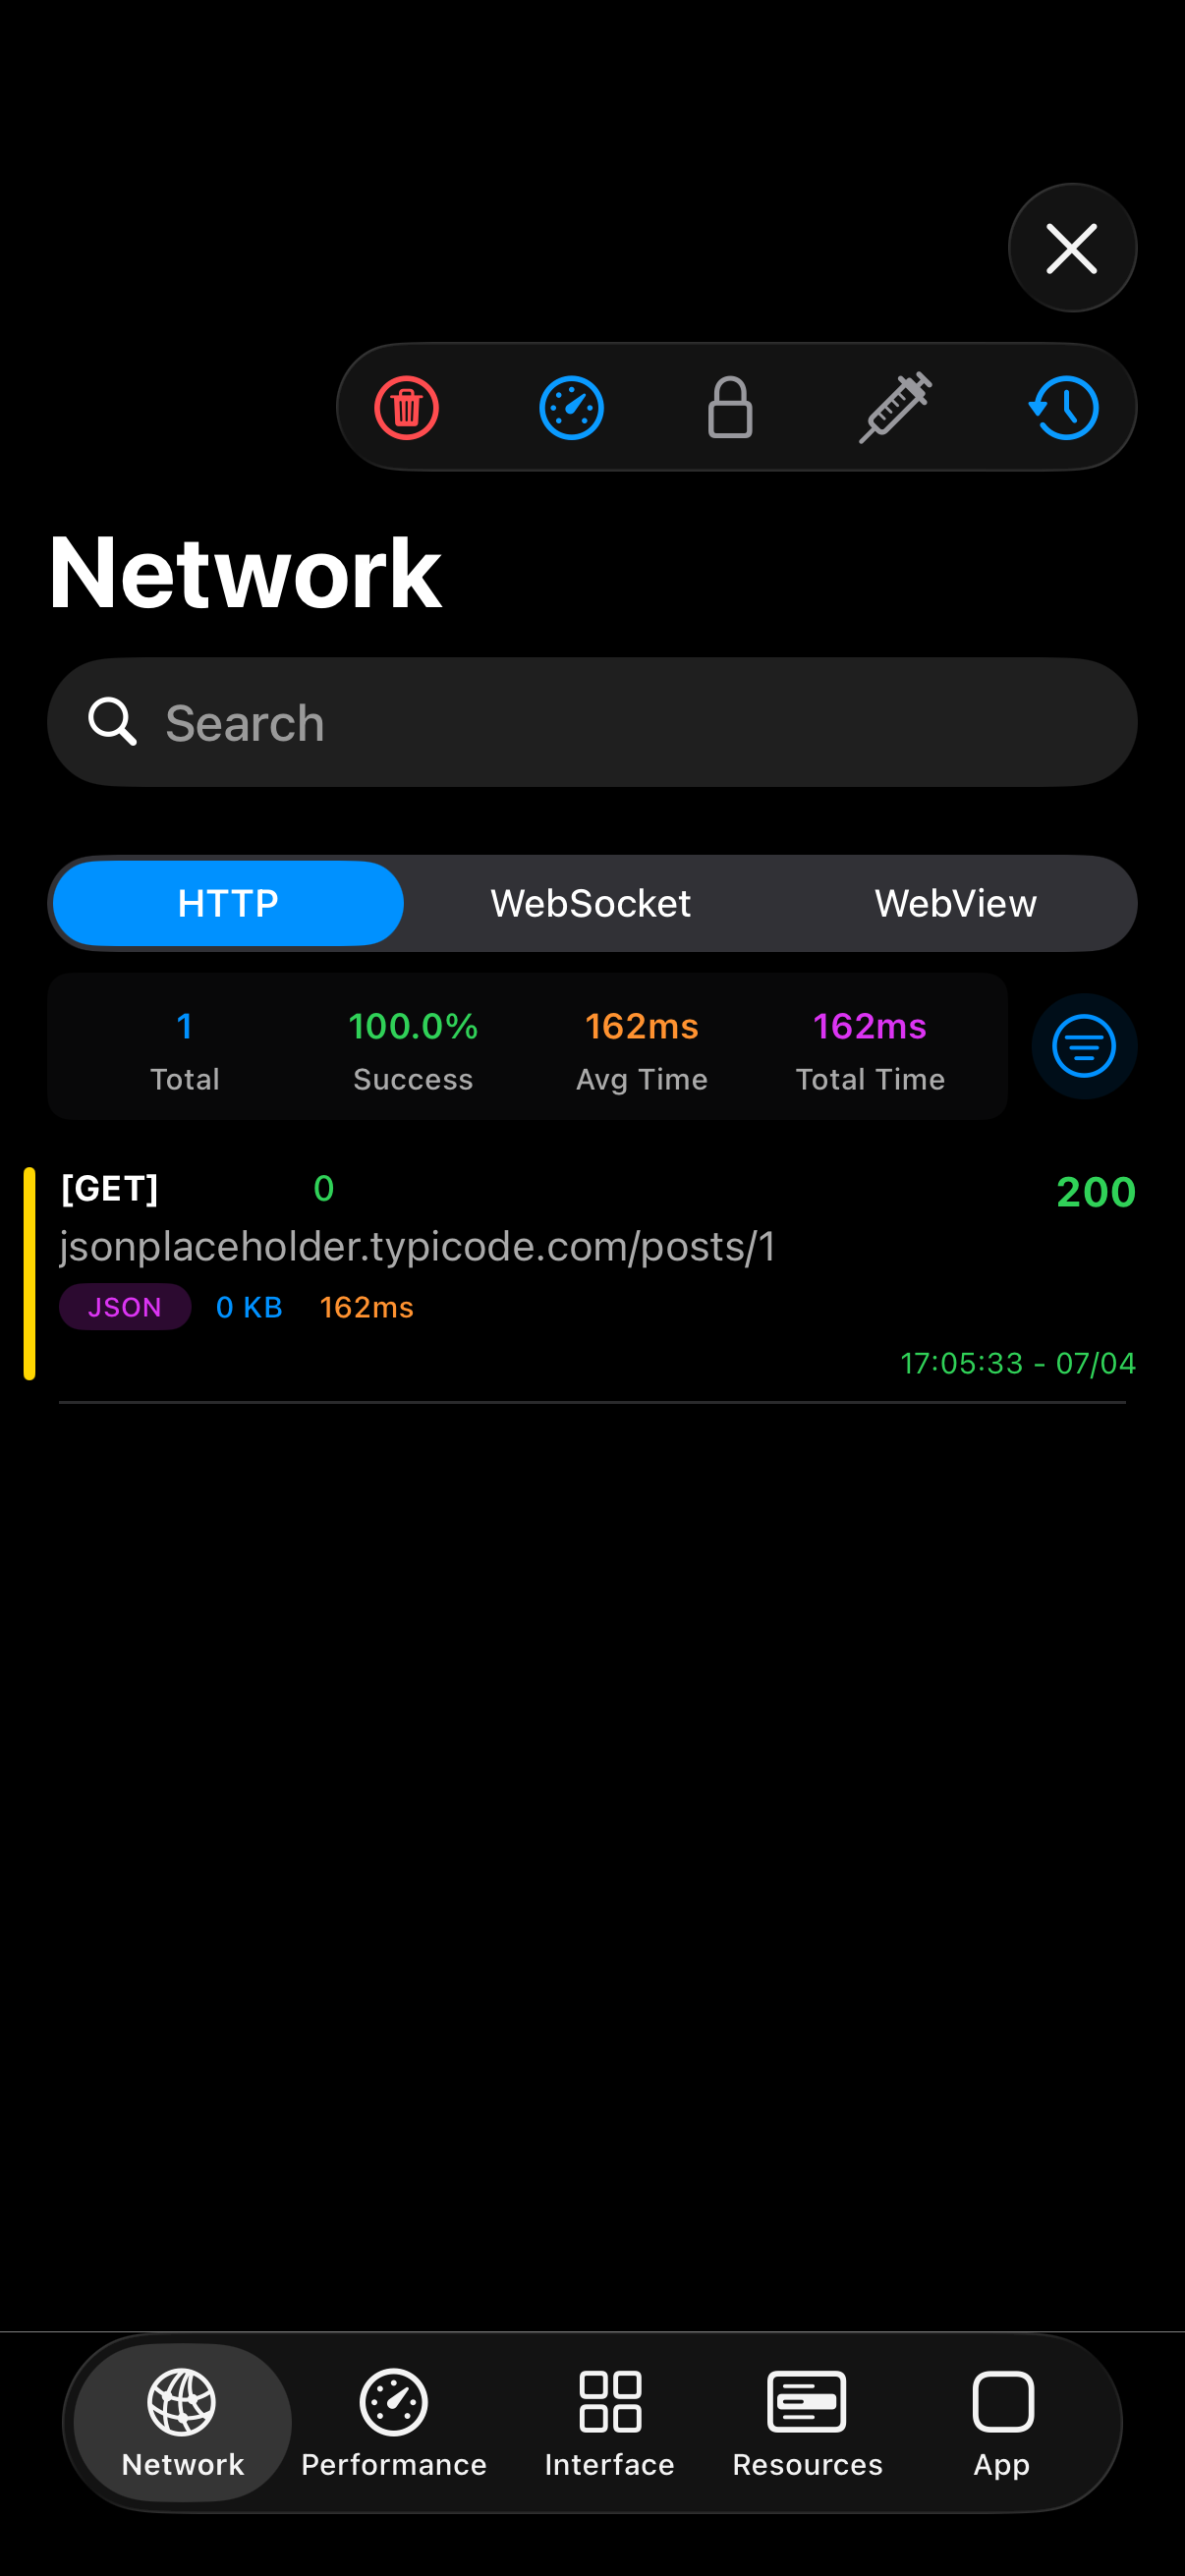

What you see in the inspector
- Request and response headers with syntax-highlighted JSON bodies
- Timing information for each transaction
- Status codes, redirects, and error states
- Filtering by URL pattern to cut analytics noise
- Encrypted payloads decrypted in-place when you register AES keys or custom decryptors
Encrypted APIs
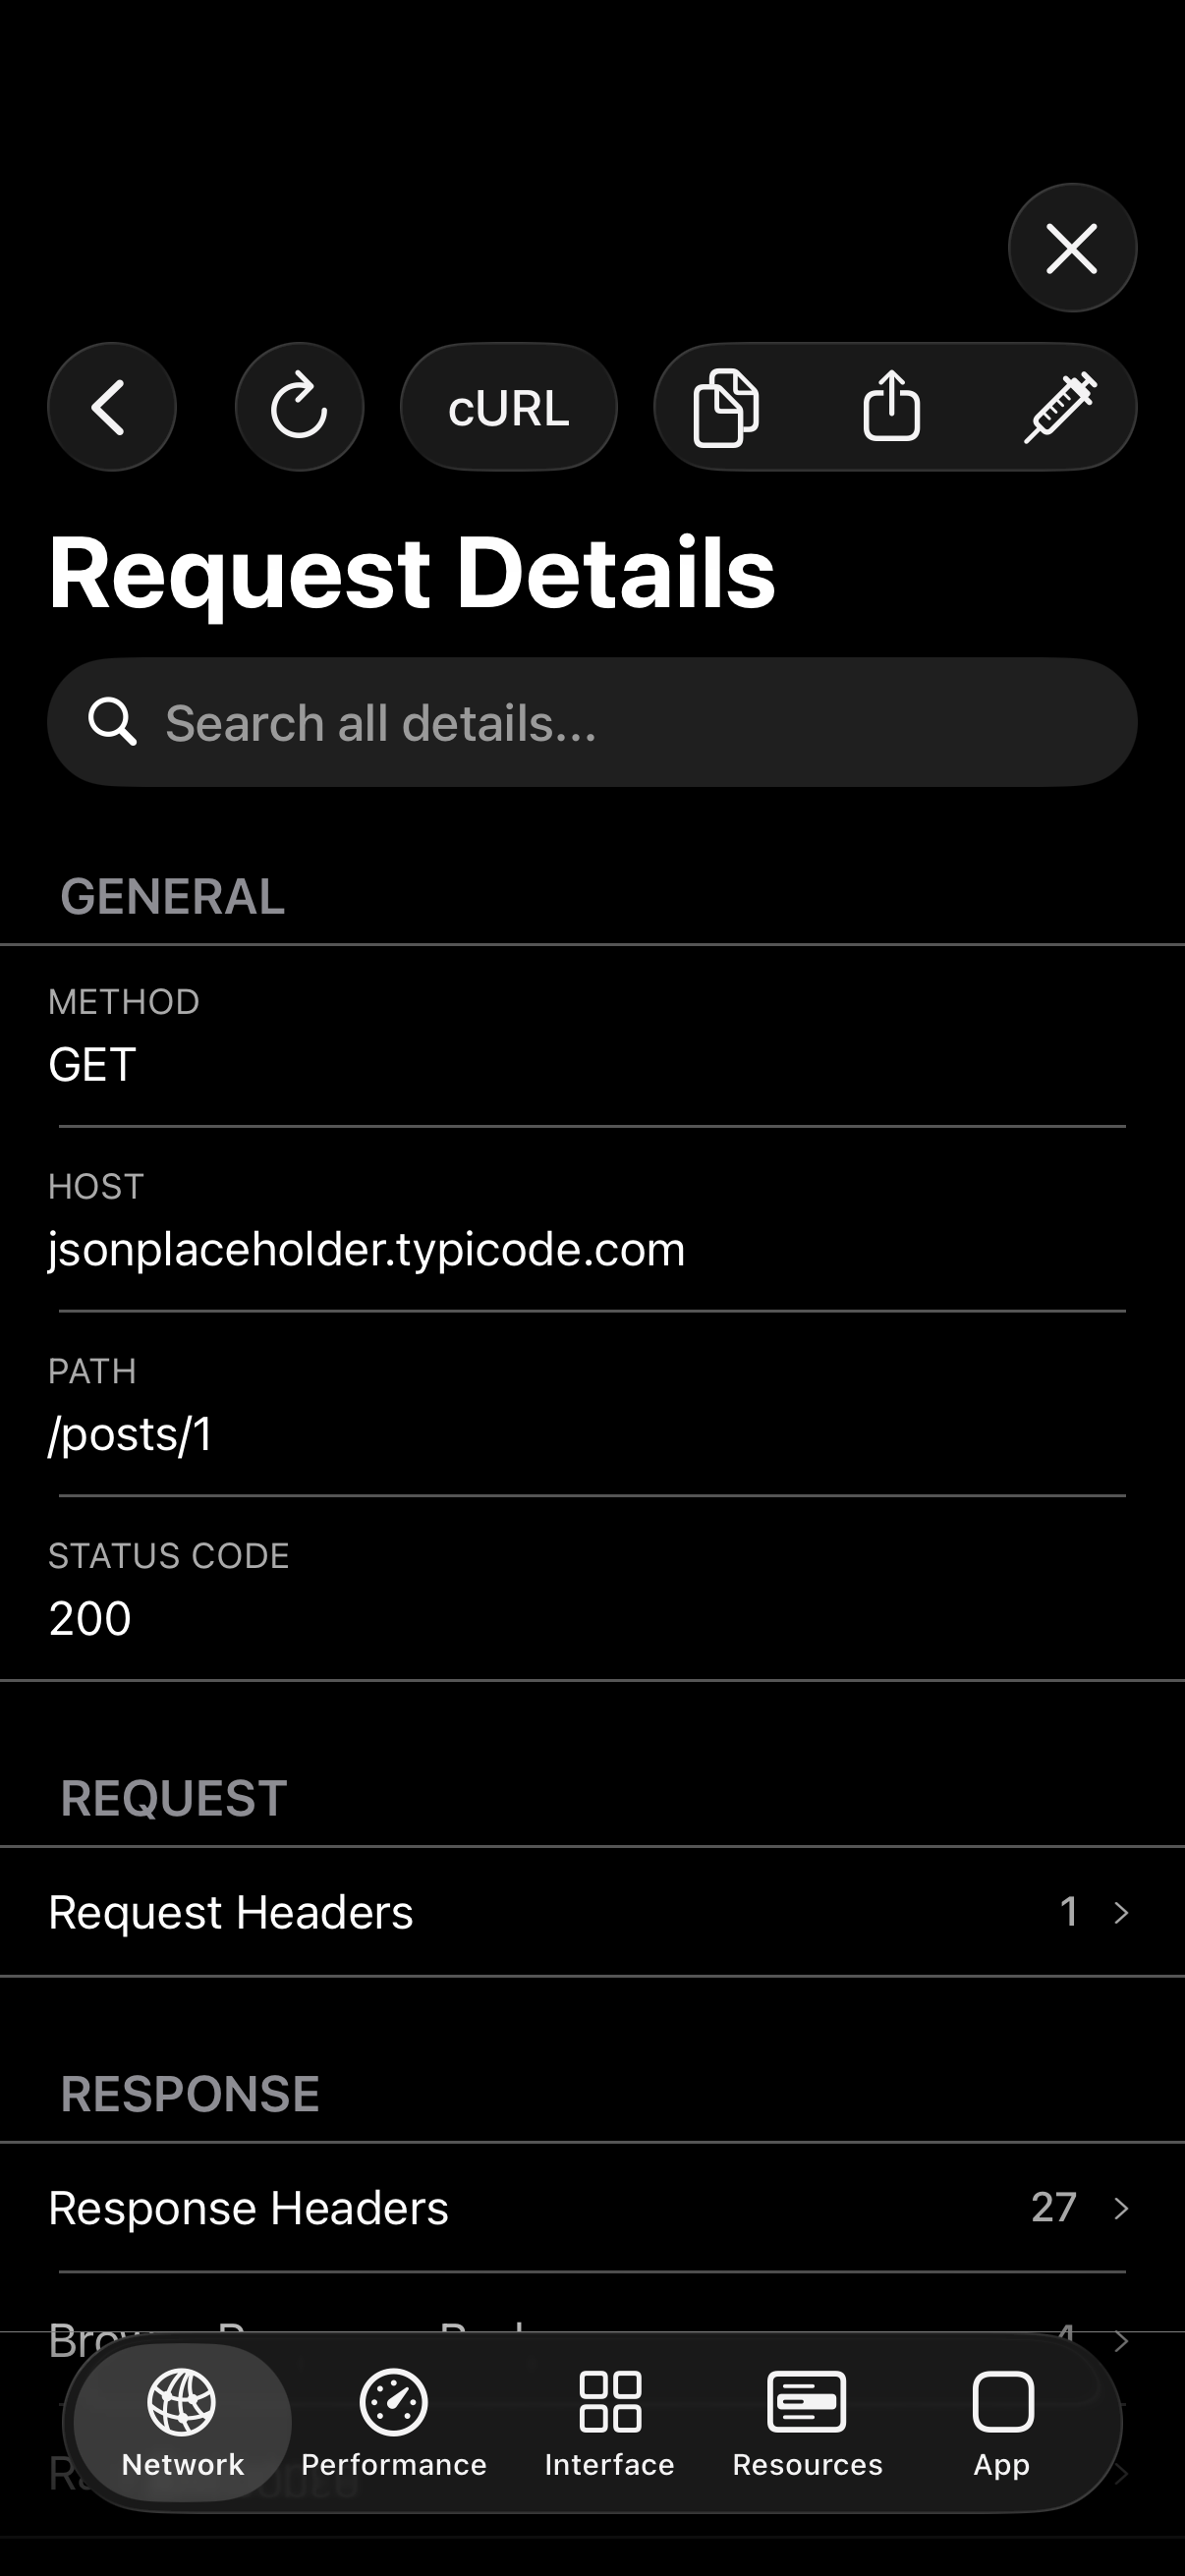
Some backends return AES-encrypted JSON wrapped in base64. A proxy shows ciphertext. DebugSwift can decrypt responses in the inspector when you register your key or a custom decryptor closure — the ciphertext remains available in the raw view for comparison.
Mocking without a backend
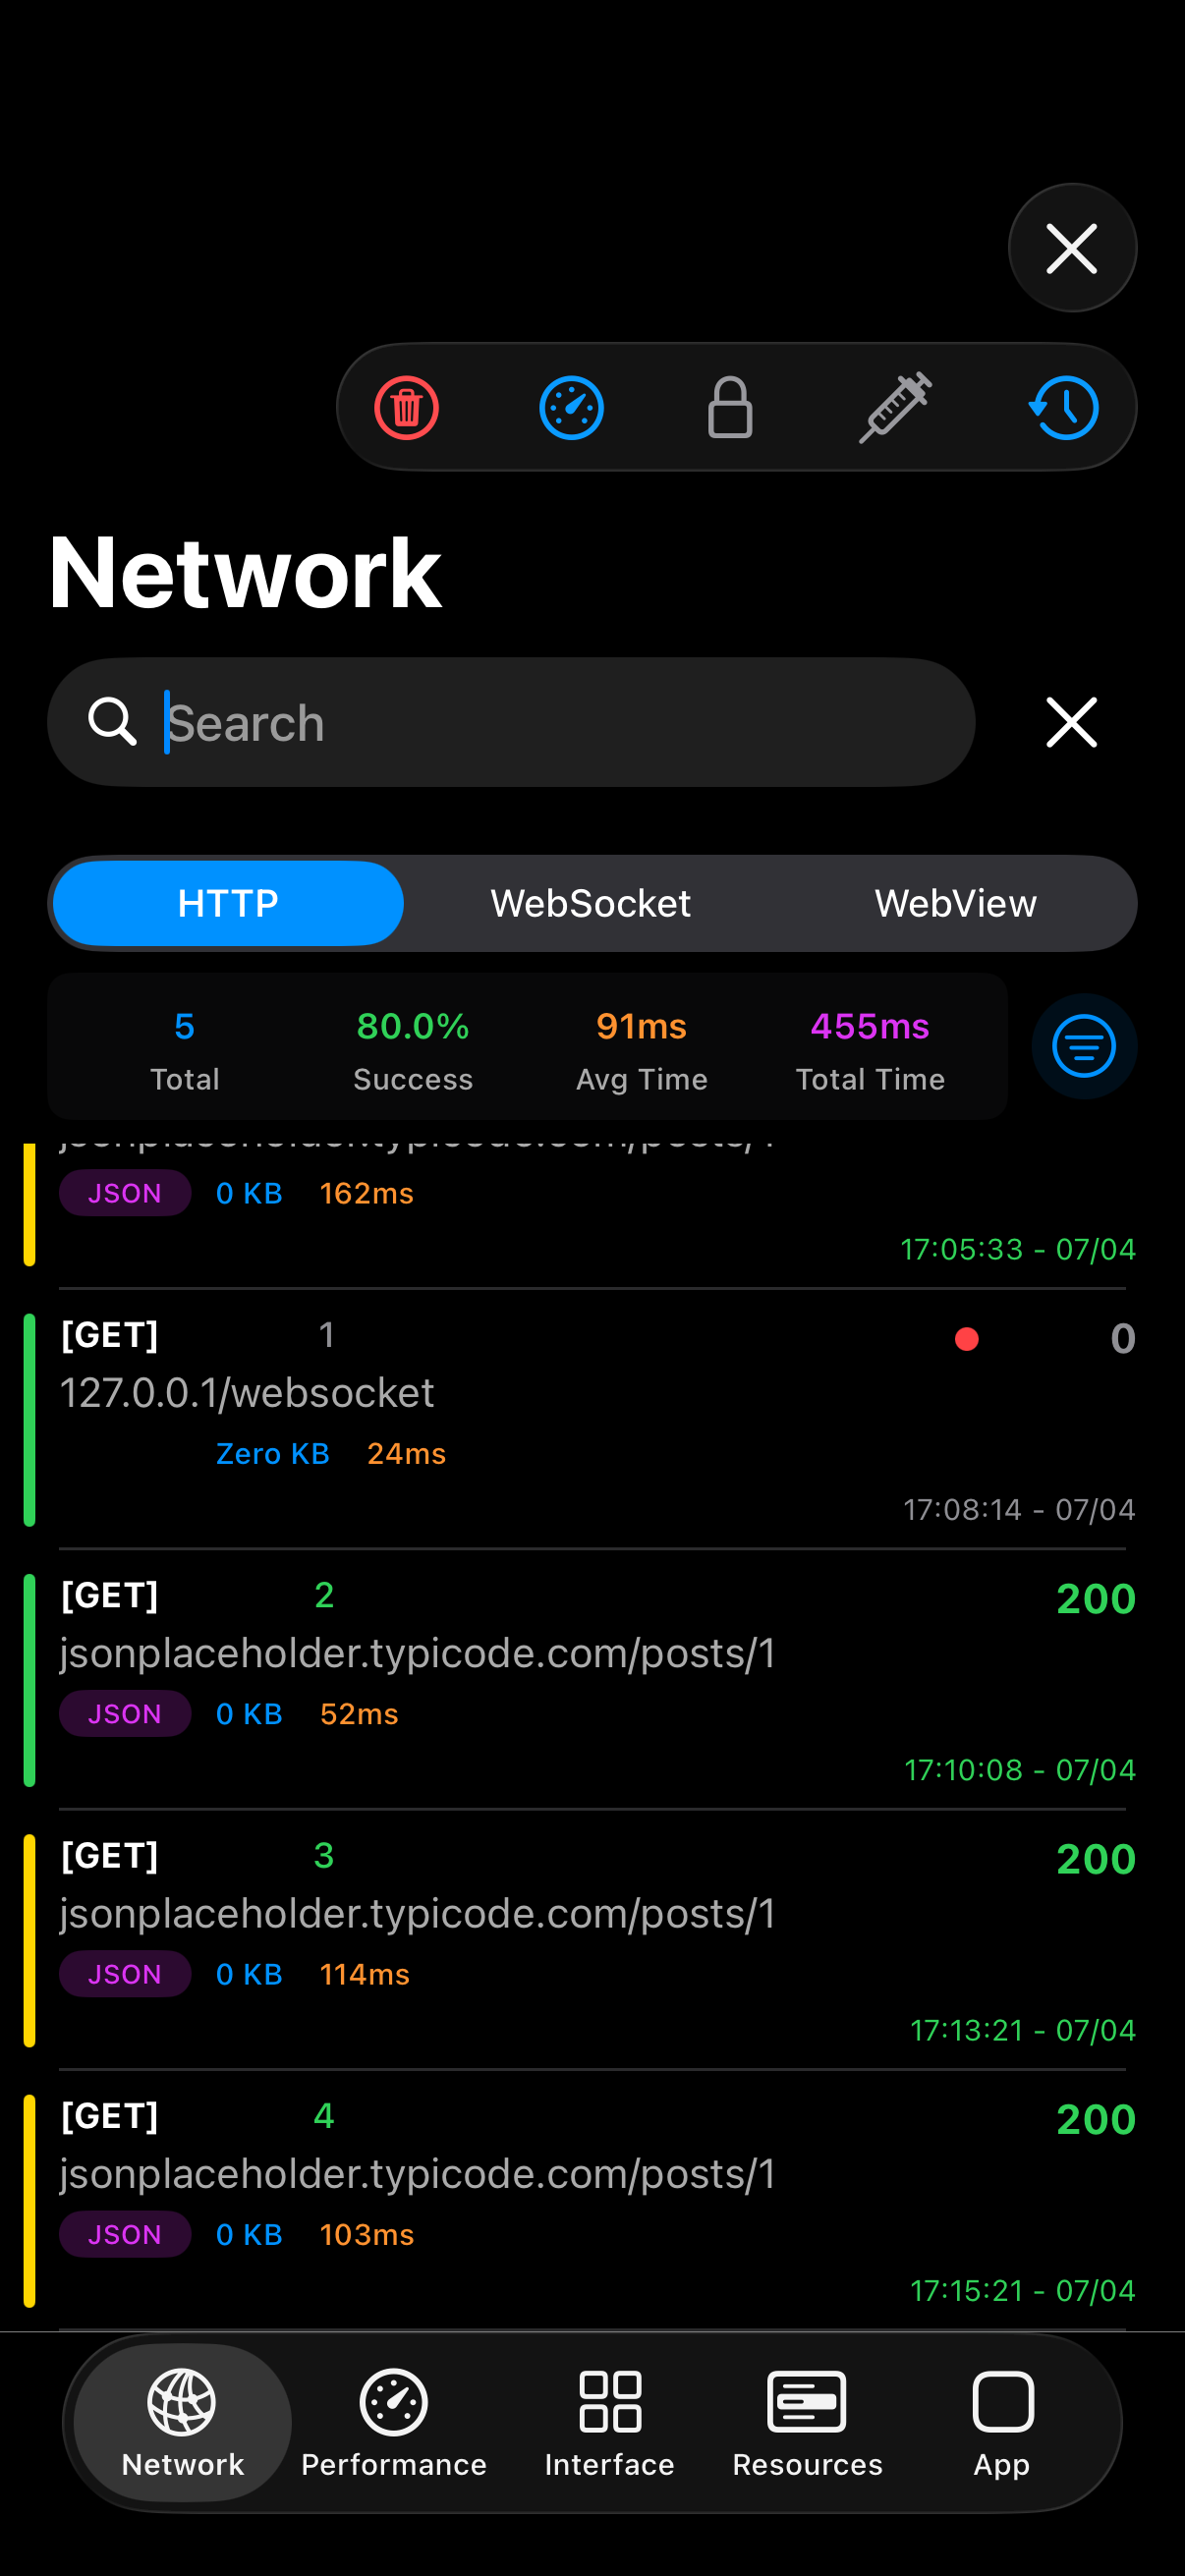
The Response Modifier rewrites status codes and bodies for matching URLs at runtime. Test error states, empty lists, and edge-case payloads without deploying a staging server. Rules can be generated from live traffic you just captured.
When to use a proxy instead
In-app capture excels for URLSession-based traffic inside your DEBUG build. A system proxy still wins when you need to inspect traffic from multiple apps simultaneously, debug WKWebView content that bypasses URLSession, capture CLI tools, or set request breakpoints mid-flight. Many teams use both: DebugSwift for daily iOS work, a macOS proxy for cross-process or pinning-heavy scenarios.
Getting started
Add DebugSwift via SPM, call setup() inside #if DEBUG, and tap the floating debug ball. Every URLSession request from that point forward appears in the Network tab. If you create URLSessionConfiguration before setup(), inject the monitoring configuration manually — see the configuration docs for details.