For years, Flipper was the default debugging companion for React Native and many native iOS teams. Meta integrated it into the RN template, shipped desktop plugins for network and layout inspection, and made it the path of least resistance. That changed: React Native 0.73 deprecated first-party Flipper support, and 0.74 removed the native integration from new project templates. Flipper as a standalone product still exists, but it is no longer the recommended default — and native iOS teams need a replacement that does not depend on a desktop bridge.
Architectural difference
Flipper connects a desktop Electron app to your mobile app over a socket. Plugins on the desktop side render network traffic, databases, and layout trees relayed from the device. DebugSwift runs entirely inside your iOS app as a UIKit overlay. There is no host machine requirement, no plugin installation on desktop, and no socket handshake to debug when connections fail.
Side-by-side comparison
- Setup — Flipper: desktop app + SDK + RN bootstrap code. DebugSwift: SPM/CocoaPods + setup().show()
- License — Flipper: BSD-style Meta license. DebugSwift: MIT
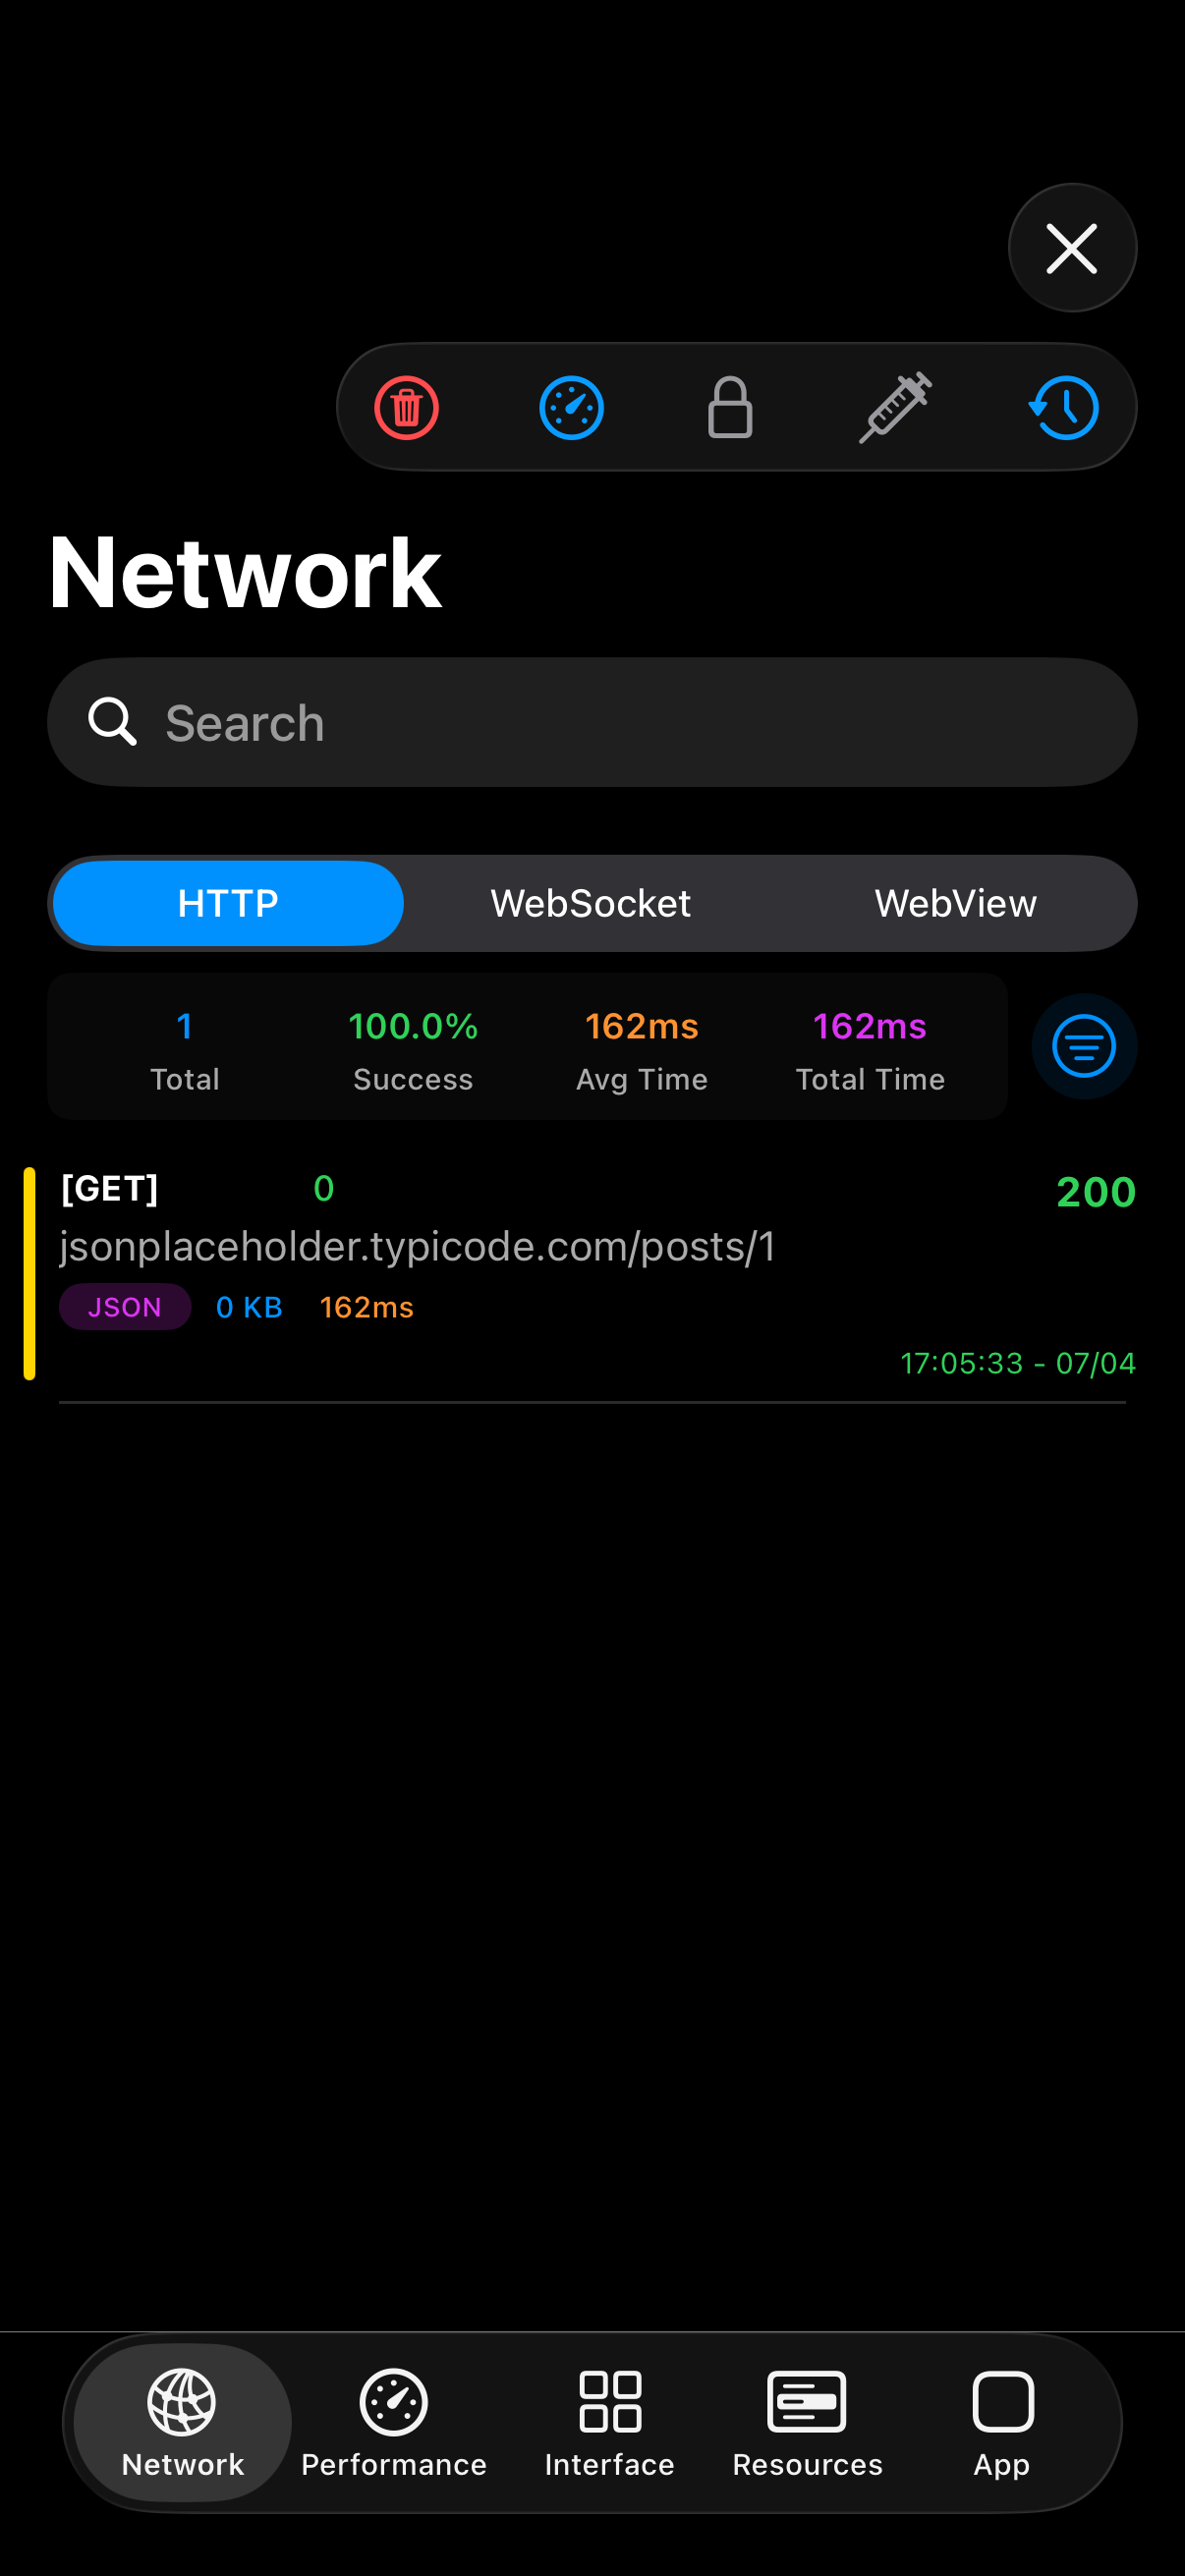
- Network — Flipper: desktop Network plugin. DebugSwift: in-process URLSession capture with decryption and response mocking
- Layout — Flipper: desktop Layout plugin. DebugSwift: 3D view hierarchy, grid, borders, touch indicators in-app
- Leaks — Flipper: limited native support. DebugSwift: automatic UIViewController leak detection with stack traces
- SwiftUI — Flipper: no first-class render tracking. DebugSwift: beta SwiftUI render overlay
- Release safety — Both should be DEBUG-only; DebugSwift enforces via #if DEBUG compile stripping
- Maintenance — Flipper decoupled from RN core. DebugSwift: active iOS-first development

Migrating from Flipper
Remove Flipper SDK dependencies and bootstrap code from your Podfile or Gradle config. Add DebugSwift via Swift Package Manager. Wrap initialization in #if DEBUG:
#if DEBUG
import DebugSwift

@main
struct MyApp: App {
    init() {
        DebugSwift()setup()show()
    }
    // ...
}
#endif
When Flipper still makes sense
If you rely on a specific Flipper plugin that has no DebugSwift equivalent — a custom Redux inspector, a proprietary analytics plugin, or cross-platform Android+iOS debugging from one desktop — keeping Flipper for that workflow may be justified. For standard native iOS needs (network, layout, logs, sandbox, performance), an in-app toolkit removes the desktop dependency and matches how Swift teams already work in Xcode.
React Native teams
JavaScript debugging now flows through React Native DevTools (Hermes). Native-layer inspection — the part Flipper's plugins handled — falls to Xcode and in-app tools. DebugSwift covers the native iOS side: URLSession traffic, crashes, sandbox files, and UI inspection inside your RN host app without reopening Flipper.